September 06, 2025 a 07:47 am


AVB: Dividend Analysis - AvalonBay Communities, Inc.
AvalonBay Communities, Inc., a prominent player in the real estate sector, presents an intriguing dividend profile characterized by a consistent dividend history and respectable yield. While its payout ratios are relatively high, indicating a strong commitment to returning capital to shareholders, the company's financials reveal a need to balance this commitment with sustainable growth. This analysis will delve into the key aspects of AVB's dividend strategy and financial health.
📊 Overview
In the context of its sector, AvalonBay Communities, Inc. displays a robust dividend yield of 3.39%, positioning it attractively for income-focused investors. The company has maintained a dividend distribution for 32 consecutive years, showcasing its resilience and shareholder-friendly approach. However, investors should be aware of the potential risks associated with the company's high payout ratios.
| Metric | Details |
|---|---|
| Sector | Real Estate |
| Dividend yield | 3.39% |
| Current dividend per share | 6.77 USD |
| Dividend history | 32 years |
| Last cut or suspension | None |
📈 Dividend History
AvalonBay's long-standing history of increasing dividends is a testament to its commitment to returning value to shareholders. The consistency in dividend payments, particularly over 32 years, acts as a reassuring factor for investors. Regular dividend payments are crucial as they provide a predictable income stream and indicate financial health.
| Year | Dividend Per Share (USD) |
|---|---|
| 2025 | 3.50 |
| 2024 | 6.80 |
| 2023 | 6.60 |
| 2022 | 6.36 |
| 2021 | 6.36 |
📉 Dividend Growth
The measured growth of AvalonBay's dividends over the past 3 and 5 years indicates stability. With a five-year average dividend growth of approximately 2.26%, the company shows moderate but steady dividend expansion. Sustained growth in dividends is a positive indicator of profitability and management confidence.
| Time | Growth |
|---|---|
| 3 years | 2.25% |
| 5 years | 2.26% |
The average dividend growth is 2.26% over 5 years. This shows moderate but steady dividend growth.
🔍 Payout Ratio
The payout ratio is crucial for assessing a company's ability to sustain dividend payments. AVB's EPS-based payout ratio stands at 83.05%, while the FCF-based ratio is 69.55%. These figures suggest a high level of dividend payout, which could potentially impact the company's capacity to reinvest in growth opportunities.
| Key figure | Ratio |
|---|---|
| EPS-based | 83.05% |
| Free cash flow-based | 69.55% |
With an EPS payout ratio of 83.05% and FCF payout ratio of 69.55%, AVB demonstrates a strong commitment to returning profits to shareholders. However, the elevated ratios indicate the need for careful management to ensure the sustainability of dividend payments.
💸 Cashflow & Capital Efficiency
An in-depth analysis of cash flow and capital efficiency is essential for understanding the operational effectiveness of a company. Key metrics like the Free Cash Flow Yield, Earnings Yield, and others provide a comprehensive view of financial health.
| Metrics | 2024 | 2023 | 2022 |
|---|---|---|---|
| Free Cash Flow Yield | 4.51% | 5.15% | 5.53% |
| Earnings Yield | 3.46% | 3.51% | 5.04% |
| CAPEX to Operating CF | 12.32% | 12.65% | 12.29% |
| Stock-based Comp. to Revenue | 0.87% | 0.98% | 1.31% |
| Free CF / Operating CF Ratio | 87.68% | 87.35% | 87.71% |
Analyzing these metrics reveals AvalonBay's commendable cash flow generation capabilities, with a consistently high Free Cash Flow Yield. This indicates a reliable capacity to manage capital expenditures and sustain dividend payouts.
📊 Balance Sheet & Leverage Analysis
Evaluating the balance sheet and leverage ratios is vital for assessing financial stability and risk. The debt-to-equity and leverage ratios are key indicators of the company’s financial health.
| Metrics | 2024 | 2023 | 2022 |
|---|---|---|---|
| Debt-to-Equity | 0.69 | 0.69 | 0.75 |
| Debt-to-Assets | 0.39 | 0.39 | 0.41 |
| Debt-to-Capital | 0.41 | 0.41 | 0.43 |
| Net Debt to EBITDA | 3.83 | 3.94 | 3.58 |
| Current Ratio | 0.36 | 0.76 | 1.11 |
| Quick Ratio | 0.36 | 0.76 | 1.11 |
AVB's leverage ratios reflect a moderate level of debt, indicating a withstandable financial risk. While the quick and current ratios suggest a solid liquidity position, maintaining this balance will be pivotal for future fiscal health.
📈 Fundamental Strength & Profitability
Assessing fundamental strength and profitability involves examining key margins and returns. This analysis provides a comprehensive overview of the company’s financial performance and potential.
| Metrics | 2024 | 2023 | 2022 |
|---|---|---|---|
| Return on Equity | 9.06% | 7.88% | 10.10% |
| Return on Assets | 5.15% | 4.49% | 5.56% |
| Net Margin | 37.13% | 33.56% | 43.83% |
| EBIT Margin | 44.93% | 41.35% | 53.26% |
| EBITDA Margin | 73.99% | 70.87% | 84.68% |
| Gross Margin | 63.16% | 64.30% | 64.56% |
The high return on equity and strong margins reflect AvalonBay's robust profitability and efficient operational management. These metrics underscore the company's ability to generate profit from its shareholder's equity.
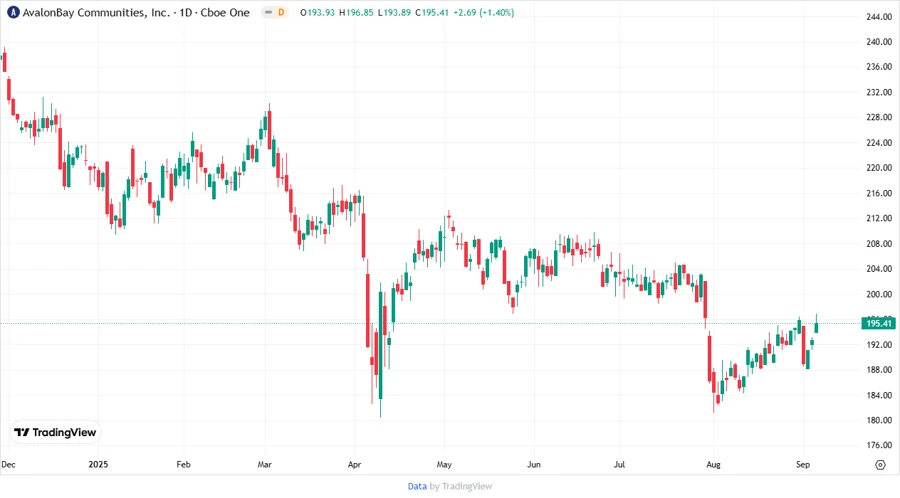
📉 Price Development
✅ Dividend Scoring System
| Criteria | Score (1-5) | Score Bar |
|---|---|---|
| Dividend yield | 4 | |
| Dividend Stability | 5 | |
| Dividend growth | 3 | |
| Payout ratio | 3 | |
| Financial stability | 4 | |
| Dividend continuity | 5 | |
| Cashflow Coverage | 3 | |
| Balance Sheet Quality | 4 |
Total Score: 31/40
🗣️ Rating
AvalonBay Communities, Inc. demonstrates notable strengths in dividend stability and financial robustness, making it an attractive choice for dividend investors. While the dividend growth is moderate, the company's enduring commitment to dividend payments over three decades reinforces confidence. However, prospective investors should remain vigilant about the relatively high payout ratios and ensure that dividend sustainability aligns with future strategic initiatives. Overall, AVB is a sound investment for those seeking income with stability, given its reliable track record and potential for continued growth in a dynamic market environment.
Smart Data Insight
Master the Perfect Entry & Exit for this Stock
Don't leave your profits to chance. Historically, this stock follows specific seasonal patterns that institutional traders use to maximize returns.
- ✅ Identify the "Golden Buying Window"
- ✅ Avoid high-risk correction cycles
- ✅ Backtested data from the last 20+ years