July 20, 2025 a 07:30 am


AVB: Dividend Analysis - AvalonBay Communities, Inc.
AvalonBay Communities, Inc. demonstrates a robust dividend profile with a consistent history and a reasonable yield. The current financial metrics indicate a secure position in dividend payments, reflecting a stable income strategy. With moderate dividend growth, the company presents a reliable opportunity for income-focused investors. 🏛️
📊 Overview
The detailed overview of AvalonBay highlights the dividend-paying capabilities and sector positioning.
| Metrics | Details |
|---|---|
| Sector | Real Estate |
| Dividend Yield | 3.39% |
| Current Dividend per Share | 6.77 USD |
| Dividend History | 32 years |
| Last Cut or Suspension | None |
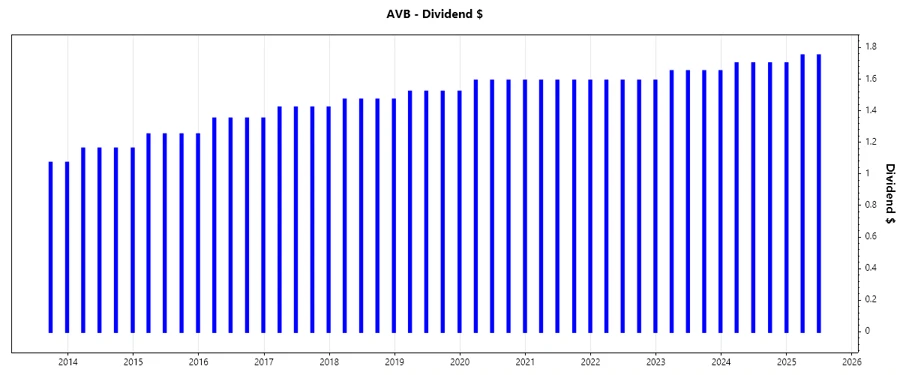
🗣️ Dividend History
The dividend history is critical as it illustrates the company's commitment to returning profits to shareholders over time. Consistent payments indicate financial health and management stability.
| Year | Dividend per Share |
|---|---|
| 2025 | 3.50 |
| 2024 | 6.80 |
| 2023 | 6.60 |
| 2022 | 6.36 |
| 2021 | 6.36 |
📈 Dividend Growth
Tracking dividend growth provides insights into a company's capacity to increase its dividend payouts. This metric is crucial for predicting future dividend income potential.
| Time | Growth |
|---|---|
| 3 years | 2.25% |
| 5 years | 2.26% |
The average dividend growth is 2.26% over 5 years. This shows moderate but steady dividend growth.
✅ Payout Ratio
The payout ratio is a valuable indicator of dividend sustainability. It measures the proportion of earnings distributed as dividends, providing insights into retention for growth versus shareholder returns.
| Key Figure | Ratio |
|---|---|
| EPS-based | 84.07% |
| Free Cash Flow-based | 68.74% |
The EPS-based payout ratio of 84.07% suggests a high portion of earnings paid as dividends, while the FCF-based ratio of 68.74% is more moderate, indicating healthy cash flow backing dividends.
📉 Cashflow & Capital Efficiency
Evaluating cash flow and capital efficiency is key to understanding the company's financial flexibility and investment efficiency. These metrics help gauge liquidity and operational success.
| Metric | 2024 | 2023 | 2022 |
|---|---|---|---|
| Free Cash Flow Yield | 4.51% | 5.15% | 5.53% |
| Earnings Yield | 3.46% | 3.51% | 5.04% |
| CAPEX to Operating Cash Flow | 12.32% | 12.65% | 12.29% |
| Stock-based Compensation to Revenue | 0.87% | 0.98% | 1.31% |
| Free Cash Flow / Operating Cash Flow Ratio | 87.68% | 87.35% | 87.71% |
The consistent free cash flow yield and careful capital allocation ensure sound financial stability, essential for sustaining dividends.
⚠️ Balance Sheet & Leverage Analysis
A robust balance sheet and manageable leverage ratios are crucial for long-term financial health and risk mitigation.
| Metric | 2024 | 2023 | 2022 |
|---|---|---|---|
| Debt-to-Equity | 0.69 | 0.69 | 0.74 |
| Debt-to-Assets | 0.39 | 0.39 | 0.41 |
| Debt-to-Capital | 0.41 | 0.41 | 0.42 |
| Net Debt to EBITDA | 3.78 | 3.94 | 4.71 |
| Current Ratio | 0.36 | 0.75 | 1.17 |
| Quick Ratio | 0.36 | 0.75 | 1.12 |
| Financial Leverage | 1.76 | 1.75 | 1.82 |
The leverage analysis indicates a well-managed debt position, maintaining financial stability with relative low risk.
✅ Fundamental Strength & Profitability
Analyzing fundamental strength and profitability ratios is essential to assess the company's operational efficiency and potential return on investment.
| Metric | 2024 | 2023 | 2022 |
|---|---|---|---|
| Return on Equity | 9.06% | 7.88% | 10.10% |
| Return on Assets | 5.15% | 4.49% | 5.56% |
| Net Margin | 37.13% | 33.39% | 43.83% |
| EBIT Margin | 44.93% | 41.15% | 53.26% |
| EBITDA Margin | 73.99% | 70.52% | 63.12% |
| Gross Margin | 63.16% | 64.47% | 64.56% |
| R&D to Revenue | 0.00% | 0.00% | 0.64% |
The strong profitability metrics and efficient asset utilization highlight an effective operational strategy facilitating growth.
📈 Price Development
🏆 Dividend Scoring System
| Category | Points | Score Bar |
|---|---|---|
| Dividend Yield | 4 | |
| Dividend Stability | 5 | |
| Dividend Growth | 3 | |
| Payout Ratio | 4 | |
| Financial Stability | 4 | |
| Dividend Continuity | 5 | |
| Cashflow Coverage | 4 | |
| Balance Sheet Quality | 4 |
Total Score: 33 out of 40
🔑 Rating
AvalonBay Communities, Inc. offers a solid dividend profile with a commendable history of payments. The moderate growth and strong financial indicators make it a suitable choice for income-seeking investors, especially with its stable market presence. We recommend a "Buy" based on the robust fundamentals and consistent dividend strategy. 📈
Smart Data Insight
Master the Perfect Entry & Exit for this Stock
Don't leave your profits to chance. Historically, this stock follows specific seasonal patterns that institutional traders use to maximize returns.
- ✅ Identify the "Golden Buying Window"
- ✅ Avoid high-risk correction cycles
- ✅ Backtested data from the last 20+ years