
September 01, 2026 a 04:28 am

AUDUSD: Trend and Support & Resistance Analysis
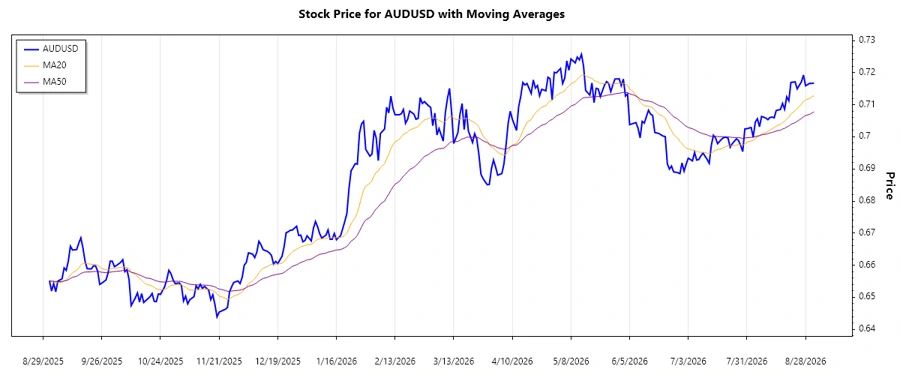
The AUD/USD currency pair, seen over the recent months, has exhibited a notable shift in market sentiment. Careful examination reveals a reversion from a sustained downtrend, suggesting a potential bullish reversal. The upcoming weeks are crucial as the pair approaches key resistance levels.
Trend Analysis
The analysis of the last few months shows a recovering AUD/USD with signs of strength after a period of weakness. Calculating the Exponential Moving Averages (EMA) on the closing prices, the EMA20 has recently surpassed the EMA50, indicating a potential short-term uptrend. This crossover and recent price action suggest a bullish sentiment.
| Date | Close Price | Trend |
|---|---|---|
| 2026-09-01 | 0.71676 | ▲ Uptrend |
| 2026-08-31 | 0.71661 | ▲ Uptrend |
| 2026-08-30 | 0.71667 | ▲ Uptrend |
| 2026-08-28 | 0.71591 | ▲ Uptrend |
| 2026-08-27 | 0.71925 | ▲ Uptrend |
| 2026-08-26 | 0.7171 | ▲ Uptrend |
| 2026-08-25 | 0.71605 | ▲ Uptrend |
The recent trend indicates increased bullish sentiment, supported by the price movement around EMA indicators. Monitoring station at key resistances will determine longer-term sentiments.
Support and Resistance
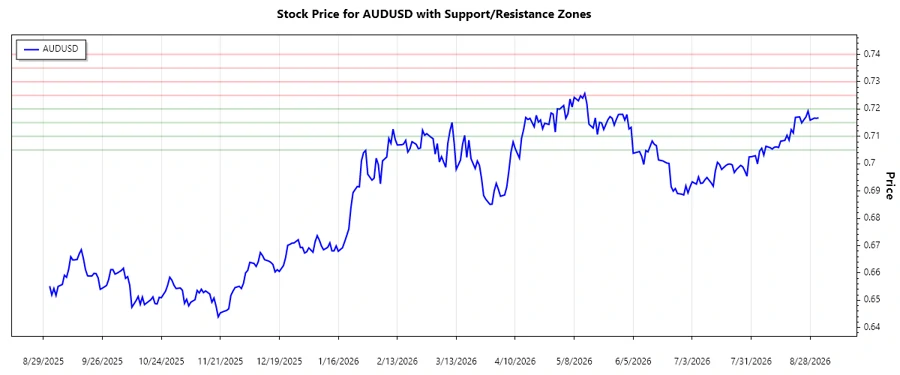
Given the market's recent performance, support and resistance zones have been pinpointed. Two main support zones are noted at 0.705 to 0.710 and 0.715 to 0.720. Resistance appears strong around 0.725 to 0.730 and 0.735 to 0.740.
| Zone Type | From | To |
|---|---|---|
| Support ➖ | 0.705 | 0.710 |
| Support ➖ | 0.715 | 0.720 |
| Resistance ➖ | 0.725 | 0.730 |
| Resistance ➖ | 0.735 | 0.740 |
The current price of AUD/USD is approaching a support zone between 0.715 and 0.720, indicating a potential pullback or consolidation area before attempting to break the listed resistance levels.
Conclusion
As of now, the AUD/USD pair demonstrates a cautiously optimistic uptrend, bolstered by technical indicators pointing to potential short-term gains. However, the looming resistance zones might challenge this growth, creating consolidation or reversal opportunities. Analysts should monitor the support levels as any breach could redefine market directions. For traders, the next steps hinge upon the pair's ability to maintain momentum and breach established resistances.
Smart Data Insight
Master the Perfect Entry & Exit for this Stock
Don't leave your profits to chance. Historically, this stock follows specific seasonal patterns that institutional traders use to maximize returns.
- ✅ Identify the "Golden Buying Window"
- ✅ Avoid high-risk correction cycles
- ✅ Backtested data from the last 20+ years