
July 21, 2026 a 04:28 am
AUDUSD: Trend and Support & Resistance Analysis
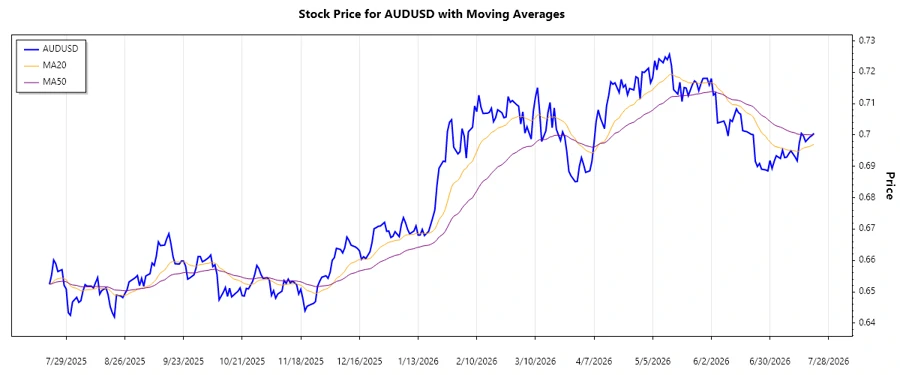
The AUDUSD currency pair has recently shown fluctuations within defined boundaries, suggesting a technical convergence. Both support and resistance levels demonstrate pivotal points that traders should monitor. The trend indicates a mixed sentiment, but careful analysis of existing zones may present opportunities for strategic positions, considering current economic indicators influencing Australian and US markets.
Trend Analysis
The AUDUSD exhibits varied movements over the analyzed period. Calculating the Exponential Moving Average (EMA), we observe substantial trends:
| Date | Close Price | Trend |
|---|---|---|
| 2026-07-21 | 0.70051 | ▲ Uptrend |
| 2026-07-20 | 0.6998 | ▼ Downtrend |
| 2026-07-19 | 0.69933 | ▲ Uptrend |
| 2026-07-17 | 0.69787 | ▼ Downtrend |
| 2026-07-16 | 0.69966 | ▲ Uptrend |
| 2026-07-15 | 0.7005 | ▲ Uptrend |
| 2026-07-14 | 0.69737 | ▼ Downtrend |
The overall trend from the recent data suggests a potential uptrend as indicated by the EMA calculations. Strategically, this aligns with the sessions where short-term bullish positions could benefit.
Support and Resistance
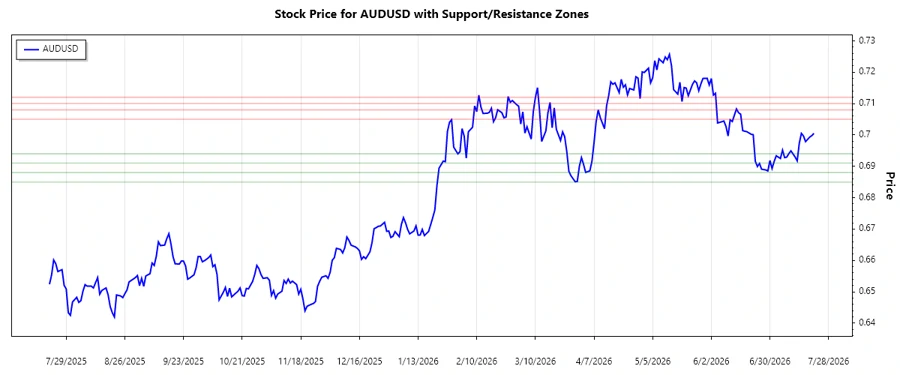
The following are significant support and resistance areas derived from the closing prices:
| Zone Type | From | To |
|---|---|---|
| Support Zone 1 | 0.691 | 0.694 |
| Support Zone 2 | 0.685 | 0.688 |
| Resistance Zone 1 | 0.705 | 0.708 |
| Resistance Zone 2 | 0.710 | 0.712 |
Currently, the AUDUSD is trading near the upper boundary of a support zone, which may provide a foundation for bullish momentum. However, caution is advised as market dynamics could shift.
Conclusion
The AUDUSD's technical pattern underscores a dynamic environment requiring attentiveness to ongoing data. With identifiable support and resistance levels, traders can capitalize on short to medium-term movements. However, external economic factors and unforeseen events could play pivotal roles in shaping near-future directions. Profound comprehension of these zones offers a leeway for optimizing trading strategies, balancing risks with potential rewards.
Smart Data Insight
Master the Perfect Entry & Exit for this Stock
Don't leave your profits to chance. Historically, this stock follows specific seasonal patterns that institutional traders use to maximize returns.
- ✅ Identify the "Golden Buying Window"
- ✅ Avoid high-risk correction cycles
- ✅ Backtested data from the last 20+ years