January 08, 2026 a 04:28 am

AUDUSD: Trend and Support & Resistance Analysis
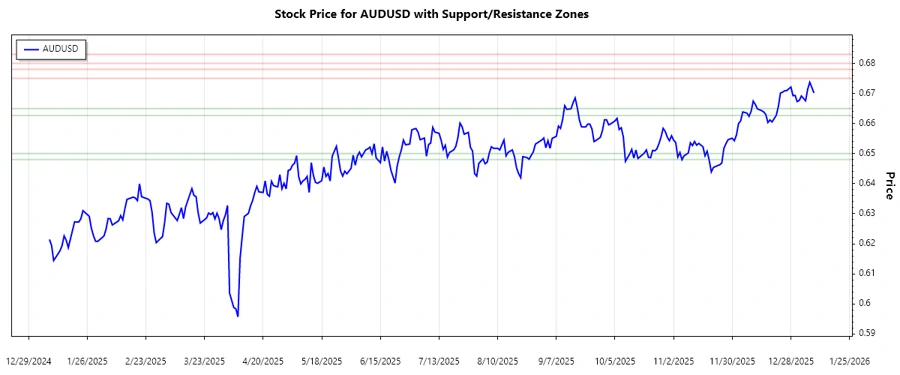
The AUDUSD has experienced a fluctuating market with recent upward momentum. Traders should be cautious as the currency moves through significant support and resistance zones. Observing the moving averages provides a clearer picture of the ongoing trend.
Trend Analysis
| Date | Close Price | Trend |
|---|---|---|
| 2026-01-08 | 0.67016 | ▲ Uptrend |
| 2026-01-07 | 0.67200 | ▲ Uptrend |
| 2026-01-06 | 0.67373 | ▲ Uptrend |
| 2026-01-05 | 0.67140 | ▲ Uptrend |
| 2026-01-04 | 0.66756 | ▲ Uptrend |
| 2026-01-02 | 0.66917 | ▲ Uptrend |
| 2026-01-01 | 0.6677 | ▲ Uptrend |
The recent data suggests a strong uptrend, as indicated by the EMA calculations where EMA20 is greater than EMA50.
Support and Resistance
| Zone Type | From | To |
|---|---|---|
| Support ▼ | 0.66270 | 0.66500 |
| Support ▼ | 0.64800 | 0.65000 |
| Resistance ▲ | 0.67500 | 0.67800 |
| Resistance ▲ | 0.68000 | 0.68300 |
The current price of AUDUSD appears to be approaching a resistance zone, which could stall the upward trend unless broken through.
Conclusion
The AUDUSD shows potential for continuation in its upward trend with EMA20 above EMA50. However, it is approaching a resistance level that may hinder further gains. Traders should watch for a break above resistance levels for confirmation of further bullish momentum. Risks include potential reversal if resistance holds strong. Support levels provide strategic entry points for potential buy strategies.