October 14, 2025 a 04:28 am
AUDUSD: Trend and Support & Resistance Analysis
The AUDUSD currency pair has shown variations in market trends recently. While periods of upward momentum are evident, a closer examination reveals various levels of resistance having been tested repeatedly. This indicates the need for meticulous attention to EMA levels, as they further clarify the potential directional shifts of this pair. Currently, evaluating the support and resistance zones can provide further insight into potential future movements. Analysts should remain cautious yet adaptive to market indicators.
Trend Analysis
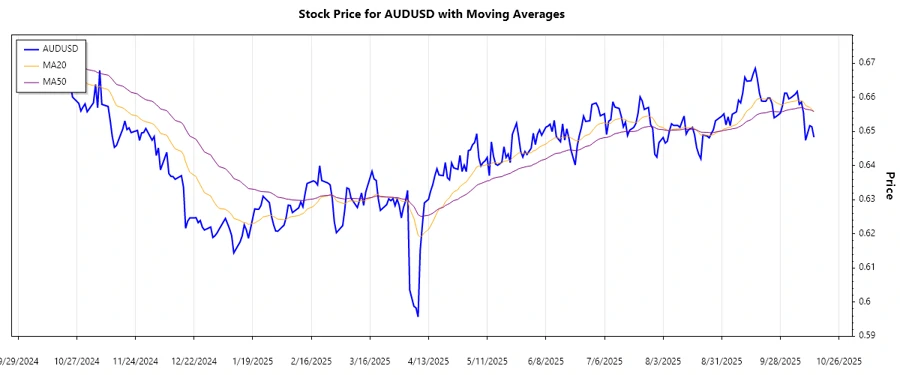
The analysis of the closing prices and EMA calculations suggests an overall bearish trend for AUDUSD in the recent past. The EMA20 has crossed below the EMA50, signaling a ▼ downward trend. Observing the last 7 days, prices have consistently remained low, with EMA20 maintaining a lower position compared to EMA50.
| Date | Closing Price | Trend |
|---|---|---|
| 2025-10-14 | 0.64832 | ▼ |
| 2025-10-13 | 0.65138 | ▼ |
| 2025-10-12 | 0.6517 | ▼ |
| 2025-10-10 | 0.64742 | ▼ |
| 2025-10-09 | 0.65551 | ▼ |
| 2025-10-08 | 0.65861 | ▼ |
| 2025-10-07 | 0.658 | ▼ |
The observed data indicates a consistent downward pressure on the AUDUSD pair over these past days. This is a strong indicator for a potential continuation of bearish sentiment unless support zones are breached.
Support and Resistance
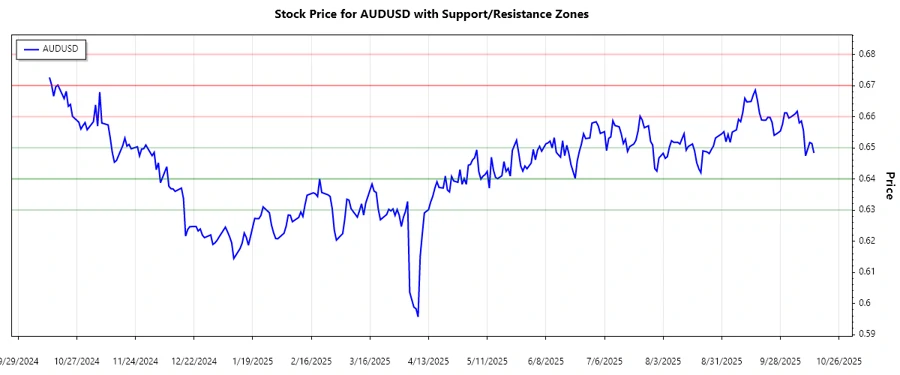
Analyzing support and resistance zones from recent data highlights two possible support levels between 0.6500 and 0.6400, and notable resistance between 0.6600 and 0.6700. On current readings, AUDUSD is lingering close to an identified support zone.
| Zone Type | From | To |
|---|---|---|
| Support Zone | 0.6500 | 0.6400 |
| Support Zone | 0.6400 | 0.6300 |
| Resistance Zone | 0.6600 | 0.6700 |
| Resistance Zone | 0.6700 | 0.6800 |
The recent price action suggests the AUDUSD pair is testing the lower support zone. An inability to hold this level could foreseeably lead to further declines.
Conclusion
In conclusion, the AUDUSD currency pair is predominantly under a bearish influence as suggested by the downward trending EMA configurations. Should the current support fail to hold, further downward momentum could be possible. However, a strong resistance above currently acts as a barrier to any upward swings. Investors are advised to meticulously monitor their entry and exit points in conjunction with these technical indicators, maintaining a cautious stance amidst these volatile market conditions.
Smart Data Insight
Master the Perfect Entry & Exit for this Stock
Don't leave your profits to chance. Historically, this stock follows specific seasonal patterns that institutional traders use to maximize returns.
- ✅ Identify the "Golden Buying Window"
- ✅ Avoid high-risk correction cycles
- ✅ Backtested data from the last 20+ years