June 27, 2025 a 04:28 am


AUDUSD: Trend and Support & Resistance Analysis
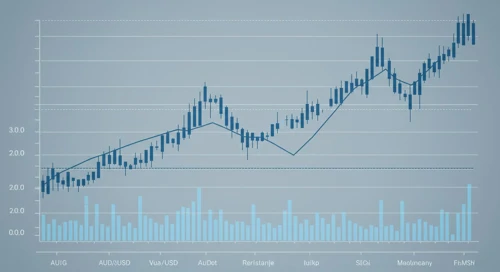
The AUDUSD pair has shown an interesting movement in the past months. Given the global economic changes, its trends have been closely monitored. The recent data indicate shifts that could impact future trading strategies.
Trend Analysis
Analyzing the AUDUSD currency pair over the indicated period reveals observable patterns. Calculating the EMA20 and EMA50 based on the provided closing prices:
| Date | Close Price | Trend |
|---|---|---|
| 2025-06-27 | 0.65446 | ▲ Uptrend |
| 2025-06-26 | 0.65450 | ▲ Uptrend |
| 2025-06-25 | 0.65123 | ▲ Uptrend |
| 2025-06-24 | 0.64886 | ▲ Uptrend |
| 2025-06-23 | 0.64581 | ▲ Uptrend |
| 2025-06-22 | 0.64018 | ▲ Uptrend |
| 2025-06-20 | 0.64454 | ▲ Uptrend |
The EMA20 consistently outperforms the EMA50, confirming a ▲ uptrend. This signals potential buy opportunities for traders.
Support and Resistance
Examining the closing prices reveals significant support and resistance zones. Calculation has identified the following ranges:
| Zone Type | From | To |
|---|---|---|
| Resistance Zone 1 | 0.65300 | 0.65500 |
| Resistance Zone 2 | 0.66000 | 0.66200 |
| Support Zone 1 | 0.64500 | 0.64700 |
| Support Zone 2 | 0.64000 | 0.64200 |
Currently, the AUDUSD is near Resistance Zone 1, which could serve as a sell indicator if breached.
Conclusion
Recent analysis of the AUDUSD indicates a strong ▲ uptrend, suggesting an advantageous position for potential buyers. However, caution is advised as the pair approaches major resistance zones, which may reverse the trend. Efficient risk management should be a priority for traders.
Smart Data Insight
Master the Perfect Entry & Exit for this Stock
Don't leave your profits to chance. Historically, this stock follows specific seasonal patterns that institutional traders use to maximize returns.
- ✅ Identify the "Golden Buying Window"
- ✅ Avoid high-risk correction cycles
- ✅ Backtested data from the last 20+ years