
November 17, 2026 a 05:08 am**Header and Introduction**:
 **Fibonacci Analysis**:
 **Conclusion**:
AUDUSD: Fibonacci Analysis
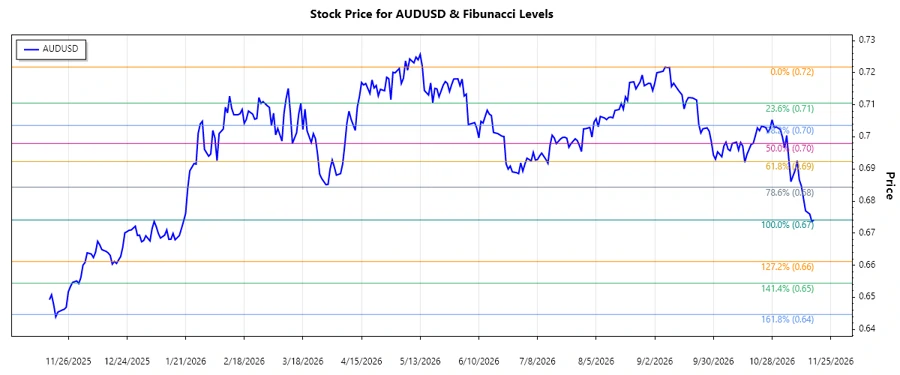
The AUDUSD currency pair has experienced significant fluctuations over recent months. The analysis suggests a dominant downward trend in the examined period. This trend reflects broader macroeconomic factors affecting both Australian and US economies, including interest rate changes and trade balances. Understanding Fibonacci retracement levels in this context could provide valuable insights for making informed trading decisions.
Fibonacci Analysis
| Key Metrics | Data |
|---|---|
| Trend Start Date | 2026-09-07 |
| Trend End Date | 2026-11-17 |
| High Point (Price and Date) | 0.72175 on 2026-09-07 |
| Low Point (Price and Date) | 0.6741 on 2026-11-17 |
Fibonacci Retracement Levels
| Level | Price |
|---|---|
| 0.236 | 0.68556 |
| 0.382 | 0.69276 |
| 0.5 | 0.69792 |
| 0.618 | 0.70308 |
| 0.786 | 0.71111 |
The current price of 0.6741 suggests it has not reached any significant Fibonacci retracement levels yet, indicating it might present a starting point for reversal considerations.
Understanding this setup allows traders to identify potential support levels or prepare for trend rebounds upon level breaches.
**Conclusion**:
Conclusion
The AUDUSD's downward trajectory highlights ongoing bearish pressure. The lack of retracement to key Fibonacci levels underscores the persistence of this trend. Analysts should remain vigilant for shifts that might signify a retracement or trend reversal. Key support and resistance levels, aligned with Fibonacci levels, provide crucial insights for risk management and strategic planning in forex trading. Understanding these levels equips traders to react proactively to evolving market dynamics, thus optimizing portfolio performance.
**JSON Output**:
Smart Data Insight
Master the Perfect Entry & Exit for this Stock
Don't leave your profits to chance. Historically, this stock follows specific seasonal patterns that institutional traders use to maximize returns.
- ✅ Identify the "Golden Buying Window"
- ✅ Avoid high-risk correction cycles
- ✅ Backtested data from the last 20+ years