
October 14, 2026 a 05:08 am
AUDUSD: Fibonacci Analysis
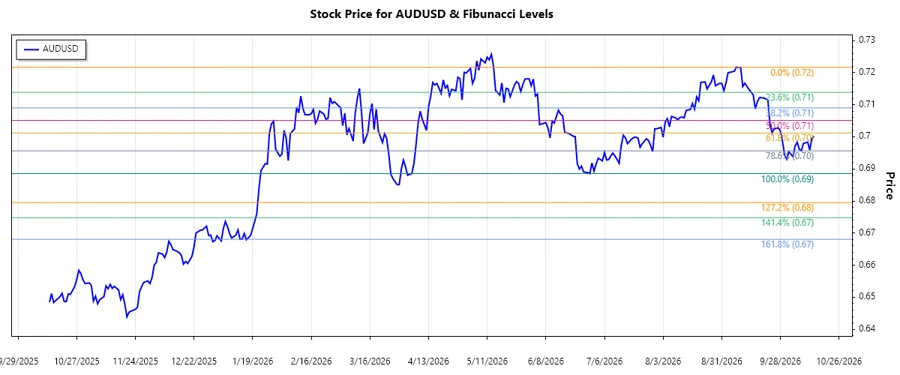
The AUDUSD currency pair has demonstrated a notable bearish trend over the recent months, characterized by continuous price decreases. This downtrend can be attributed to various macroeconomic factors, including the ongoing divergence between US Federal Reserve policies and the Reserve Bank of Australia. The volatility in global markets has also played a role in the downward pressure on the Australian dollar.
Fibonacci Analysis
| Details | Values |
|---|---|
| Trend Start Date | 2026-09-10 |
| Trend End Date | 2026-10-14 |
| High Price (Date) | 0.72167 (2026-09-09) |
| Low Price (Date) | 0.68853 (2026-06-29) |
Fibonacci Retracement Levels
| Level | Price |
|---|---|
| 0.236 | 0.71114 |
| 0.382 | 0.70513 |
| 0.5 | 0.69925 |
| 0.618 | 0.69337 |
| 0.786 | 0.68488 |
The current price of 0.70017 is hovering near the 0.5 level, indicating potential stabilization in this retracement zone. This may present a key support level, and if the price moves below, further downside could be expected.
Conclusion
In conclusion, the AUDUSD pair is undergoing a significant downward correction, likely influenced by economic policies and market volatility. The current Fibonacci retracement analysis suggests that the 0.5 level at 0.69925 is acting as a potential support level. Analysts should cautiously monitor this level, as breaking it might trigger further depreciation. This trend poses risks of continued depreciation but also offers opportunities for bullish plays if a reversal signal emerges from these support levels.
Smart Data Insight
Master the Perfect Entry & Exit for this Stock
Don't leave your profits to chance. Historically, this stock follows specific seasonal patterns that institutional traders use to maximize returns.
- ✅ Identify the "Golden Buying Window"
- ✅ Avoid high-risk correction cycles
- ✅ Backtested data from the last 20+ years