
October 06, 2026 a 05:08 am
AUDUSD: Fibonacci Analysis
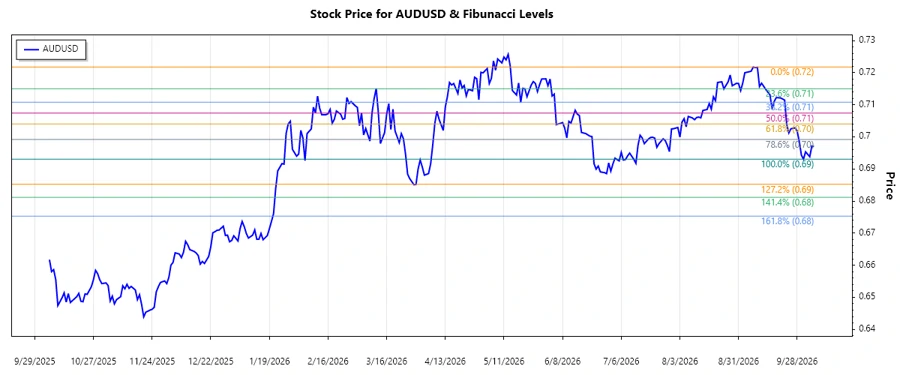
The Australian Dollar against the US Dollar (AUD/USD) has shown a significant bearish trend in recent months. The continued downward trajectory has been attributed to varying economic factors including interest rate differentials and global trade dynamics. Traders and analysts are closely monitoring this pair for potential reversal points or continuation of the trend based on macroeconomic indicators.
Fibonacci Analysis
| Detail | Information |
|---|---|
| Trend Start Date | 2026-09-01 |
| Trend End Date | 2026-10-06 |
| Highest Point | 0.72175 (2026-09-07) |
| Lowest Point | 0.69303 (2026-10-01) |
Calculated Fibonacci Levels
| Level | Price Level |
|---|---|
| 0.236 | 0.70006 |
| 0.382 | 0.70534 |
| 0.5 | 0.70739 |
| 0.618 | 0.70944 |
| 0.786 | 0.71289 |
| Current Price | Retracement Zone |
|---|---|
| 0.69696 (2026-10-06) | Below 0.236 |
The current price is below the 0.236 retracement level, indicating that the current trend might continue downward as no significant retracement level has been breached yet, suggesting possible continued bearish momentum.
Conclusion
The AUD/USD looks set to continue its bearish trend, with current levels not yet signaling a reversal. Traders should be cautious as the action remains below key Fibonacci retracements, requiring strong economic catalysts to correct. Short-term risks remain high, yet there might be potential upside opportunities should macroeconomic conditions warrant a reversal in sentiment. Vigilant monitoring of the upcoming economic releases and global market reactions will be crucial.
Smart Data Insight
Master the Perfect Entry & Exit for this Stock
Don't leave your profits to chance. Historically, this stock follows specific seasonal patterns that institutional traders use to maximize returns.
- ✅ Identify the "Golden Buying Window"
- ✅ Avoid high-risk correction cycles
- ✅ Backtested data from the last 20+ years