
September 09, 2026 a 05:08 am

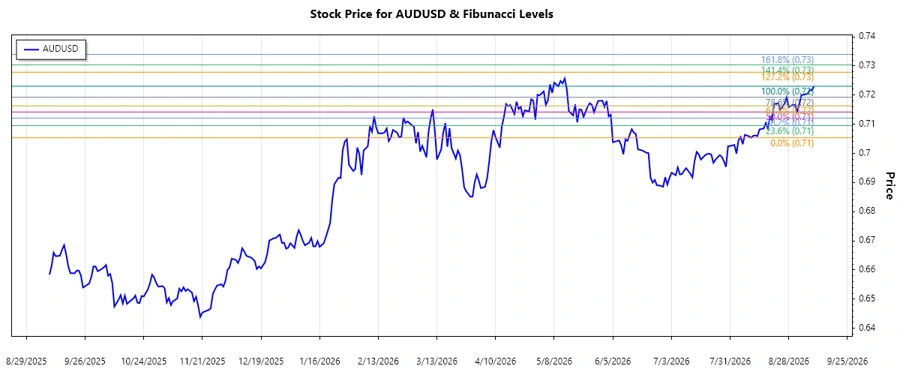
AUDUSD: Fibonacci Analysis
The AUDUSD currency pair has experienced fluctuations influenced by global economic events and monetary policies. The recent trend shows a clear movement, providing an opportunity for a precise technical analysis. Understanding these trends is crucial for traders and investors as it helps in predicting future price movements.
Fibonacci Analysis
The recent AUDUSD trend indicates a prominent upward movement from mid of August to September 2026. Using the high and low points during this period, the Fibonacci retracement levels have been calculated to identify potential support and resistance levels. These levels are crucial for traders to determine entry and exit points.
| Details | Information |
|---|---|
| Trend Start Date | 2026-08-13 |
| Trend End Date | 2026-09-09 |
| High Price | 0.72303 (2026-09-09) |
| Low Price | 0.70535 (2026-08-10) |
| Fibonacci Level | Price |
|---|---|
| 0.236 | 0.71048 |
| 0.382 | 0.71449 |
| 0.5 | 0.71719 |
| 0.618 | 0.71990 |
| 0.786 | 0.72325 |
As of the latest data, the current price is well into the 0.618 retracement zone, suggesting potential consolidation with signs of resistance at this level. Traders might interpret this as a crucial point for price reversal or continuation pattern depending on market dynamics.
This analysis concludes possible support at 0.71048 and potential resistance around 0.72325. Traders should monitor these levels closely for significant market movements.
Conclusion
The recent upward trend in the AUDUSD highlights a bullish market sentiment, backed by external economic factors favoring the Australian Dollar. However, traders should remain vigilant of the resistance levels that could slow down this momentum. Opportunities lie in short-term trades capitalizing on retracement zones, while long-term investors might await clearer signals of either continuation or reversal. It's essential to remain updated on economic releases and market news that could shift the current scenario significantly.
Smart Data Insight
Master the Perfect Entry & Exit for this Stock
Don't leave your profits to chance. Historically, this stock follows specific seasonal patterns that institutional traders use to maximize returns.
- ✅ Identify the "Golden Buying Window"
- ✅ Avoid high-risk correction cycles
- ✅ Backtested data from the last 20+ years