
June 22, 2026 a 05:08 am
AUDUSD: Fibonacci Analysis
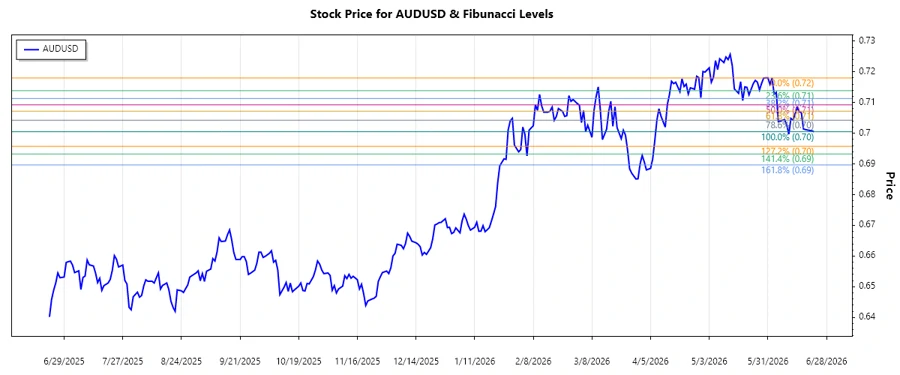
The AUD/USD exchange rate has demonstrated a strong bearish trend over recent months. After reaching its high point in early June at 0.7180, the currency pair has gradually declined, currently showing signs of a potential reversal. Market participants should monitor key technical levels, as they might influence the near-term movements of the pair.
Fibonacci Analysis
| Detail | Information |
|---|---|
| Trend Start Date | June 1, 2026 |
| Trend End Date | June 22, 2026 |
| High Point | $0.7180 (June 2, 2026) |
| Low Point | $0.70049 (June 22, 2026) |
| Fibonacci Level | Price Level |
|---|---|
| 0.236 Retracement | $0.7132 |
| 0.382 Retracement | $0.7106 |
| 0.5 Retracement | $0.7092 |
| 0.618 Retracement | $0.7077 |
| 0.786 Retracement | $0.7056 |
Currently, the price is close to the 0.786 Fibonacci level at $0.7056. This suggests a possible support level where the price might stabilize or reverse.
Technically, if the AUD/USD holds above this level, a reversal could be expected. Otherwise, a break below could continue the downtrend toward previous lows.
Conclusion
The AUD/USD pair currently navigates a significant downtrend, with potential reversal signals appearing at the 0.786 Fibonacci level. Traders should remain cautious as a break above critical retracement levels might signal a bullish reversal, offering new trading opportunities. However, sustained weakness might lead to lower lows, emphasizing the importance of technical analysis in decision-making.
Smart Data Insight
Master the Perfect Entry & Exit for this Stock
Don't leave your profits to chance. Historically, this stock follows specific seasonal patterns that institutional traders use to maximize returns.
- ✅ Identify the "Golden Buying Window"
- ✅ Avoid high-risk correction cycles
- ✅ Backtested data from the last 20+ years