February 07, 2026 a 05:08 am
AUDUSD: Fibonacci Analysis
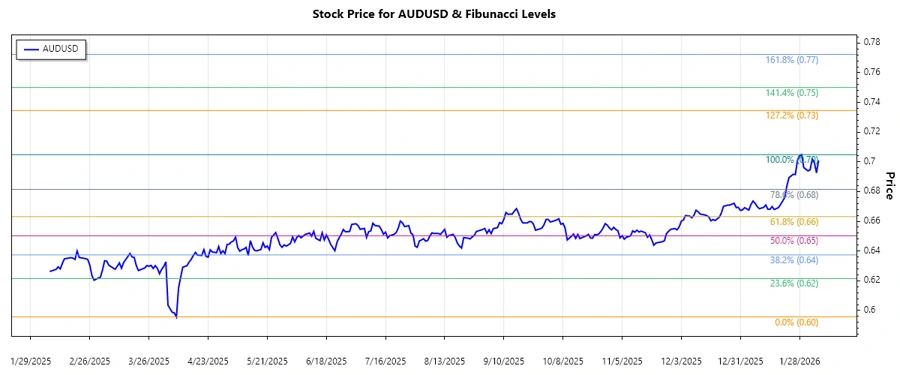
The AUDUSD currency pair has shown considerable volatility in recent months, with significant fluctuations due to global economic factors. Observing recent trends, the currency demonstrated a strong upward trend, marking recovery points and resistance levels crucial for traders. The technical analysis indicates that understanding Fibonacci levels can be invaluable for predicting potential retracement areas.
Fibonacci Analysis
| Detail | Value |
|---|---|
| Trend Start Date | 2025-04-08 |
| Trend End Date | 2026-02-06 |
| High Point | 0.70485 (2026-01-29) |
| Low Point | 0.59567 (2025-04-08) |
| Fibonacci Level | Price Level |
|---|---|
| 0.236 | 0.62344 |
| 0.382 | 0.64043 |
| 0.5 | 0.65026 |
| 0.618 | 0.66009 |
| 0.786 | 0.67592 |
The current price of 0.70101 is between 0.786 and the High Point, indicating the retracement is potentially complete, and the currency may test new resistance levels at the high.
Technically, this suggests a strong bullish momentum; however, being close to the previous high indicates increased resistance and a potential pullback.
Conclusion
In conclusion, the AUDUSD has experienced a substantial rally, highlighted by its current proximity to the previous high. This suggests continued bullish sentiment, with a potential challenge in surpassing resistance levels around the high point. Risk factors include potential macroeconomic shifts or changes in market sentiment, which could lead to a retracement. Analysts should closely watch these levels to gauge future price movements. Maintaining awareness of global economic indicators will remain pivotal for making informed trading decisions.