January 30, 2026 a 05:08 am
AUDUSD: Fibonacci Analysis
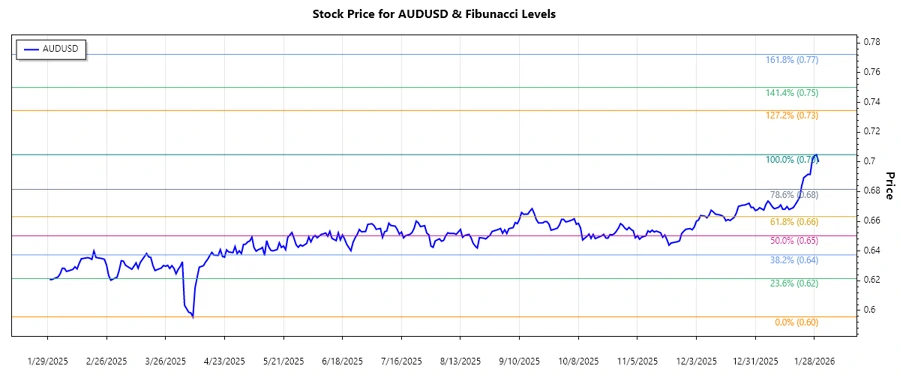
The AUDUSD currency pair has demonstrated significant volatility over the past months. Recently, a dominant uptrend has been identified, from low levels around 0.59567 in April 2025 to recent highs nearing 0.70485 by January 2026. As market conditions shift, this trend may present both opportunities and challenges for traders. Close monitoring of key levels is essential for optimizing trading strategies.
Fibonacci Analysis
Based on the significant upward movement from April 2025's low to the recent high, Fibonacci retracement levels have been calculated to ascertain potential support and resistance levels as the market adjusts. Analyzing this dominant uptrend can provide traders with critical insights into where pullbacks might find support.
| Detail | Value |
|---|---|
| Start Date of Trend | 2025-04-08 |
| End Date of Trend | 2026-01-29 |
| High Price | 0.70485 (2026-01-29) |
| Low Price | 0.59567 (2025-04-08) |
| Fibonacci Level 0.236 | 0.65047 |
| Fibonacci Level 0.382 | 0.63692 |
| Fibonacci Level 0.5 | 0.63026 |
| Fibonacci Level 0.618 | 0.62360 |
| Fibonacci Level 0.786 | 0.61477 |
| Current Price | 0.69995 |
| Retracement Zone | None |
| Technical Interpretation | The current price of 0.69995 indicates that the pair is above the 0.236 Fibonacci level, suggesting continued bullish strength. However, watch for potential pullbacks which may find support at key Fibonacci retracement levels. |
Conclusion
The AUDUSD has demonstrated strong upward momentum since April 2025, presenting traders with opportunities to capitalize on bullish trends. However, risks remain, particularly if key Fibonacci levels fail to act as support during market pullbacks. For analysts, close observation is crucial for identifying potential trend reversals or continued upward strength, as fluctuations in fundamental drivers such as interest rates, economic data, and broader market sentiment continue to influence the currency pair.