September 13, 2025 a 05:08 am
AUDUSD: Fibonacci Analysis
The Australian Dollar (AUD) against the US Dollar (USD) has exhibited a noteworthy shift in momentum over the past months. The pair has recently shown signs of recovery following a period of stabilization, indicating a potential change in trend. Analysts are closely watching the developments as macroeconomic factors may affect future movements. The AUDUSD remains a vital cross in the foreign exchange market, reflecting the economic ties between Australia and the USA.
Fibonacci Analysis
Based on recent data, the dominant trend in the AUDUSD currency pair has been identified as an upward trend. This conclusion was drawn from the observed price movements and pivot points within the analyzed timeframe.
| Metric | Details |
|---|---|
| Trend Start Date | 2024-09-13 |
| Trend End Date | 2025-09-12 |
| High Price and Date | 0.66472 on 2025-09-12 |
| Low Price and Date | 0.59567 on 2025-04-08 |
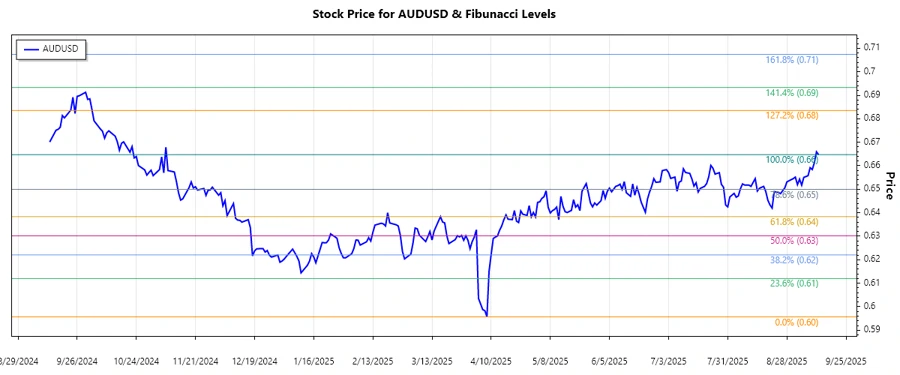
Fibonacci Retracement Levels:
| Level | Price |
|---|---|
| 0.236 | 0.61281 |
| 0.382 | 0.63032 |
| 0.5 | 0.63920 |
| 0.618 | 0.64808 |
| 0.786 | 0.65635 |
Currently, the AUDUSD is trading at 0.66472, which is above all the Fibonacci retracement levels, indicating no immediate retracement zone interaction. The recent break above key levels suggests strength and potential support at previous resistance levels.
Conclusion
The AUDUSD has shown resilience by overcoming its previous lows and advancing past crucial resistance levels. In the context of technical analysis, these movements could signal an ongoing bull market for the currency pair. However, traders are advised to monitor market shifts that might influence this trajectory. Despite these bullish signs, macroeconomic uncertainties persist which could affect the currency's outlook, necessitating a cautious approach. Overall, the AUDUSD provides a compelling case for both long-term growth and near-term volatility for analysts and traders.
Smart Data Insight
Master the Perfect Entry & Exit for this Stock
Don't leave your profits to chance. Historically, this stock follows specific seasonal patterns that institutional traders use to maximize returns.
- ✅ Identify the "Golden Buying Window"
- ✅ Avoid high-risk correction cycles
- ✅ Backtested data from the last 20+ years