August 19, 2025 a 05:08 am
AUDUSD: Fibonacci Analysis
The Australian Dollar has shown significant shifts against the US Dollar over recent months. With fluctuations driven by global economic trends, the AUDUSD pair reflects broader market volatility. Understanding these movements through technical analysis provides insights into potential future price actions.
Fibonacci Analysis
| Detail | Value |
|---|---|
| Trend Start Date | 2024-11-07 |
| Trend End Date | 2025-08-19 |
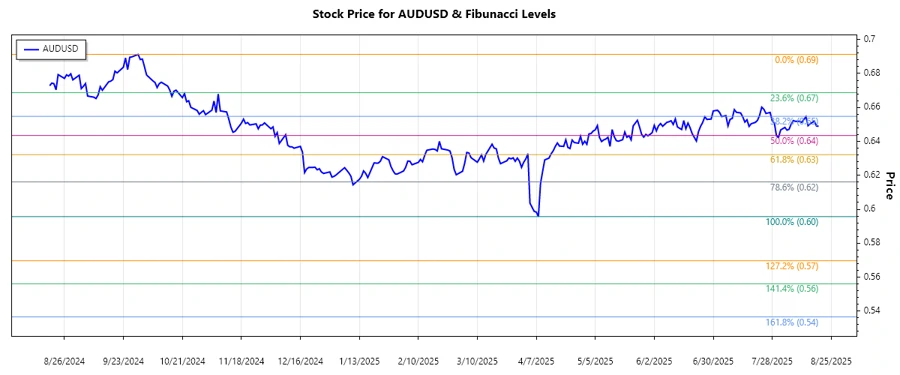
| Highest Price Point | 0.69125 on 2024-09-30 |
| Lowest Price Point | 0.59567 on 2025-04-08 |
| Fibonacci Level | Price Level |
|---|---|
| 0.236 | 0.62083 |
| 0.382 | 0.63845 |
| 0.5 | 0.65546 |
| 0.618 | 0.67247 |
| 0.786 | 0.68841 |
The current price of 0.64896 is within the 0.382 Fibonacci retracement zone, suggesting moderate retracement from its previous trend levels.
Technical interpretation suggests that this area may act as a support level, potentially indicating the endeavor for the currency pair to resume its prior uptrend.
Conclusion
AUDUSD has undergone a considerable downward trend establishing lower price actions. The currency pair's current stance suggests potential support, providing both opportunities for reversals and challenges against further depreciation. Traders and investors should consider global market movements and interrelated economic indicators that could affect the pair's valuation. Monitoring key levels and potential breakouts will be critical for accurate forecasting and strategy formulation.
Smart Data Insight
Master the Perfect Entry & Exit for this Stock
Don't leave your profits to chance. Historically, this stock follows specific seasonal patterns that institutional traders use to maximize returns.
- ✅ Identify the "Golden Buying Window"
- ✅ Avoid high-risk correction cycles
- ✅ Backtested data from the last 20+ years