August 12, 2025 a 05:08 am
AUDUSD: Fibonacci Analysis
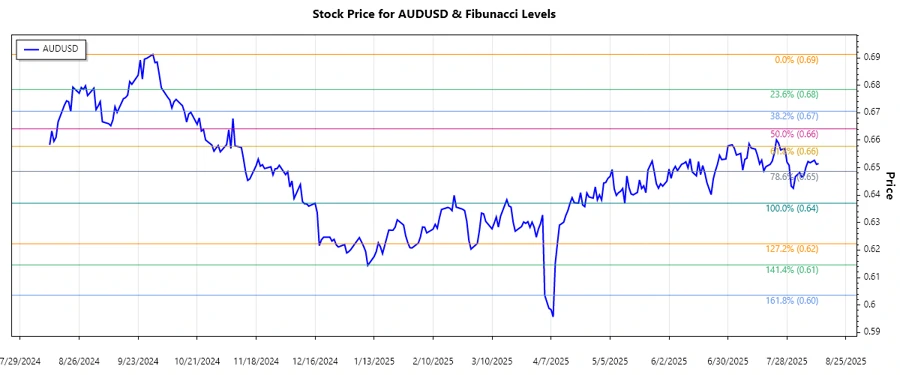
The AUDUSD has recently shown a downward trend, primarily influenced by fluctuating commodity prices and changes in interest rate expectations. Investors should be cautious of external factors such as trade relations and global economic cues. The currency pair's recent performance demonstrates vulnerability to both local and international economic changes.
Fibonacci Analysis
| Details | Information |
|---|---|
| Trend Type | Downward |
| Trend Start Date | 2024-09-30 |
| Trend End Date | 2025-08-12 |
| Highest Price | 0.69125 on 2024-09-30 |
| Lowest Price | 0.63704 on 2025-05-12 |
Fibonacci Retracement Levels
| Retracement Level | Price |
|---|---|
| 0.236 | 0.65389 |
| 0.382 | 0.6632 |
| 0.5 | 0.66467 |
| 0.618 | 0.66973 |
| 0.786 | 0.68013 |
Currently, the price is around 0.65151, indicating that it is near the 0.236 retracement level. If the price holds at this level, it suggests potential support. However, a fall below could mean further bearish momentum.
Conclusion
The AUDUSD is navigating through a volatile environment where economic indicators and global market sentiment add complexity to its trajectory. A breach below key retracement levels may bolster bearish sentiment, while holding above these levels could provide buyers with a chance to regain control. Analysts should monitor economic announcements closely, as these can sway trends quickly in the Forex market. Trading in such environments requires a clear understanding of risk management and leveraging technical analysis appropriately.
Smart Data Insight
Master the Perfect Entry & Exit for this Stock
Don't leave your profits to chance. Historically, this stock follows specific seasonal patterns that institutional traders use to maximize returns.
- ✅ Identify the "Golden Buying Window"
- ✅ Avoid high-risk correction cycles
- ✅ Backtested data from the last 20+ years