December 15, 2025 a 04:28 am
AUDNZD: Trend and Support & Resistance Analysis
The AUDNZD currency pair has shown significant movements over the past months, with noticeable fluctuations in both directions. Technical analysis suggests a potential pattern emerging, which analysts should closely watch. As market dynamics continue to shift, the importance of identifying key support and resistance levels becomes paramount. The recent trend indicators highlight areas for strategic decision-making, emphasizing the need for careful monitoring.
Trend Analysis
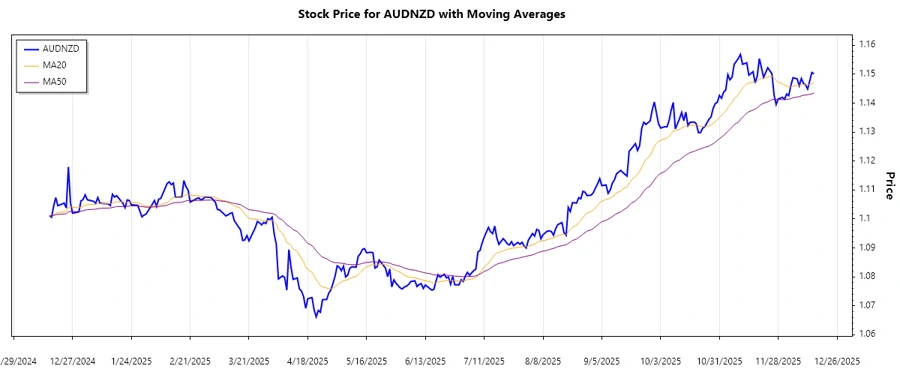
The current analysis of the closing prices for the AUDNZD reveals that the currency pair has been navigating through different phases of market behavior. Calculating the Exponential Moving Averages over 20 and 50-day periods offers a clearer view of the prevailing trend.
| Date | Closing Price | Trend |
|---|---|---|
| 2025-12-15 | 1.15012 | ▲ Uptrend |
| 2025-12-14 | 1.15061 | ▲ Uptrend |
| 2025-12-12 | 1.14487 | ▼ Downtrend |
| 2025-12-11 | 1.14636 | ⚖️ Sideways |
| 2025-12-10 | 1.14685 | ▲ Uptrend |
| 2025-12-09 | 1.14853 | ▲ Uptrend |
| 2025-12-08 | 1.14600 | ▼ Downtrend |
The EMA calculations indicate a dominant uptrend whenever EMA20 surpasses EMA50, and a downtrend when the opposite occurs. Mixed signals suggest periods of potential consolidation.
Support and Resistance
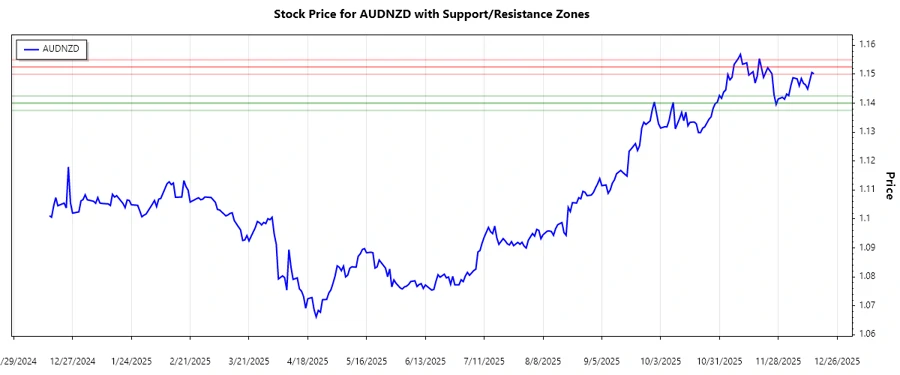
Critical levels of support and resistance play a pivotal role in the trading landscape of AUDNZD. By analyzing past closing prices, we've identified key zones where price action could pivot significantly.
| Zone Type | From | To | Direction |
|---|---|---|---|
| Support | 1.14000 | 1.14250 | ⚑ Sideways |
| Support | 1.13750 | 1.14000 | ⚑ Sideways |
| Resistance | 1.15250 | 1.15500 | ⇧ Upward |
| Resistance | 1.15000 | 1.15250 | ⇧ Upward |
Currently, AUDNZD is trading near its resistance zone, which could be pivotal for the coming sessions. Traders should be observant of breakout or reversal signals in these zones.
Conclusion
In summary, the AUDNZD currency pair presents opportunities with its fluctuating trends and precise support-resistance levels. While the uptrend dominates, the potential for volatility in resistance zones suggests caution. For analysts, these observations provide insightful data for making informed forecasts. Incorporating both strategy and flexibility in approach could optimize results in this dynamic market.