August 27, 2025 a 04:28 am
AUDNZD: Trend and Support & Resistance Analysis
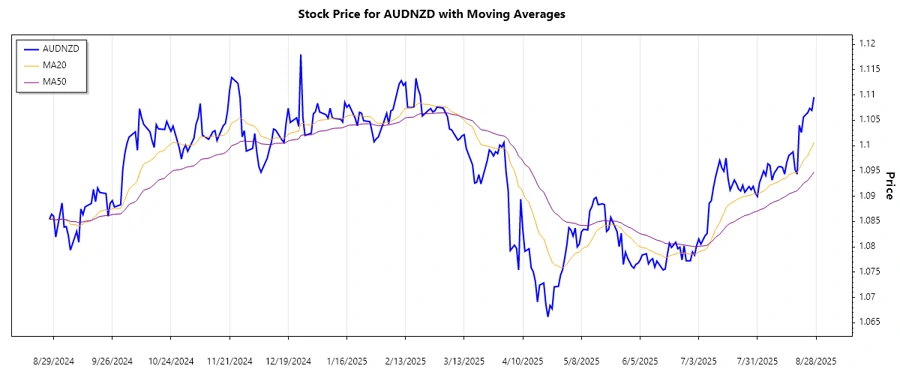
The AUDNZD forex pair has exhibited notable trends over the past months. Through analyzing the closing prices along with the calculated EMAs, it is apparent that the pair is undergoing a significant trend. Investors should take note of these developments, especially with recent movements and key support and resistance levels being formed. This analysis provides a thorough breakdown of the recent price actions and strategic zones relevant for market participants.
Trend Analysis
| Date | Closing Price | Trend |
|---|---|---|
| 2025-08-27 | 1.10958 | ▲ Uptrend |
| 2025-08-26 | 1.10695 | ▲ Uptrend |
| 2025-08-25 | 1.10735 | ▲ Uptrend |
| 2025-08-24 | 1.10646 | ▲ Uptrend |
| 2025-08-22 | 1.10564 | ▲ Uptrend |
| 2025-08-21 | 1.10255 | ▼ Downtrend |
| 2025-08-20 | 1.10401 | ▲ Uptrend |
The EMA20 is consistently above the EMA50, indicating a strong bullish trend. This aligns with the recent price movements showing a robust upward momentum.
Support and Resistance
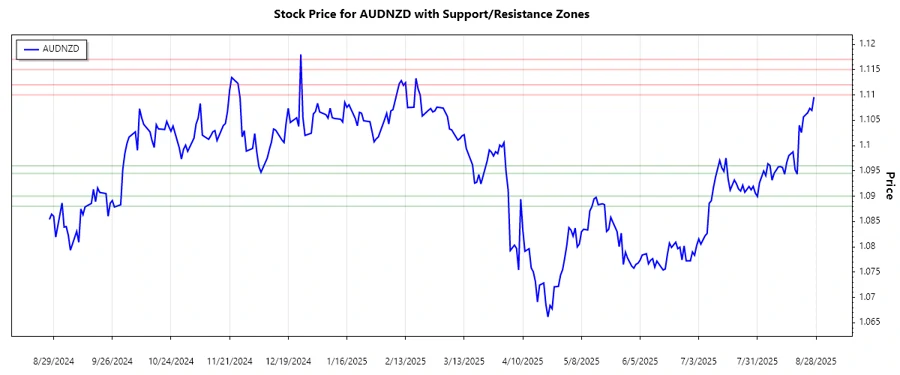
The calculated support and resistance zones based on historical data are crucial for traders. These zones provide potential entry and exit points.
| Zone Type | From | To | Direction |
|---|---|---|---|
| Support Zone 1 | 1.0945 | 1.0960 | ↔ |
| Support Zone 2 | 1.0880 | 1.0900 | ↔ |
| Resistance Zone 1 | 1.1100 | 1.1120 | ↔ |
| Resistance Zone 2 | 1.1150 | 1.1170 | ↔ |
Currently, the market price is approaching the upper resistance zone, which may act as a barrier. Traders should watch for potential breakouts.
Conclusion
The AUDNZD pair has shown a clear bullish trend supported by EMA calculations. The proximity to resistance zones hints at potential volatility. Traders should be cautious as these zones can indicate a reversal or breakthrough. Understanding these dynamics is crucial for taking timely investment decisions. A stable upward trend offers opportunities, yet the risk of encountering strong resistance could lead to price corrections.
Smart Data Insight
Master the Perfect Entry & Exit for this Stock
Don't leave your profits to chance. Historically, this stock follows specific seasonal patterns that institutional traders use to maximize returns.
- ✅ Identify the "Golden Buying Window"
- ✅ Avoid high-risk correction cycles
- ✅ Backtested data from the last 20+ years