August 18, 2025 a 04:28 am
AUDNZD: Trend and Support & Resistance Analysis
The AUDNZD pair has shown a mixed performance over the past months. Recent data suggests a consolidation phase with signs of variances in support and resistance levels. The technical indicators are closely watched for future trends, which may indicate either a strengthening or weakening in the currency pair's dynamics. Investors should pay close attention to upcoming economic data releases and market sentiments to get a clearer picture of future movements.
Trend Analysis
| Date | Closing Price | Trend |
|---|---|---|
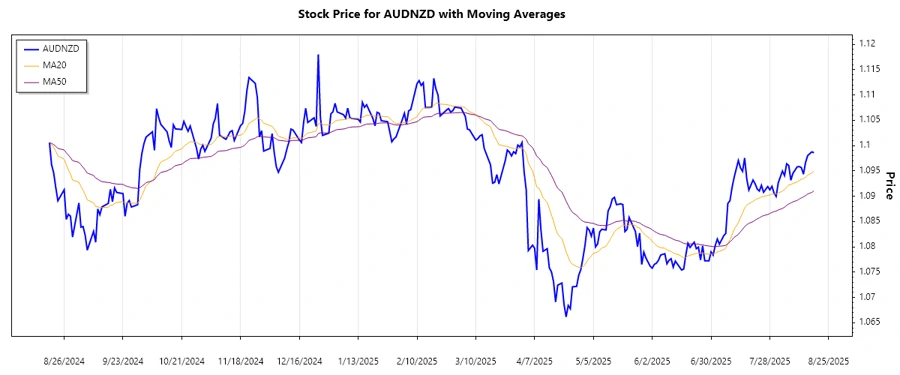
| 2025-08-18 | 1.09857 | ▲ Upward |
| 2025-08-17 | 1.09876 | ▲ Upward |
| 2025-08-15 | 1.09801 | ▲ Upward |
| 2025-08-14 | 1.09665 | ▲ Upward |
| 2025-08-13 | 1.09435 | ⚖️ Sideways |
| 2025-08-12 | 1.09565 | ⚖️ Sideways |
| 2025-08-11 | 1.09585 | ▼ Downward |
The EMA calculations suggest a cautious upward trend, supported by recent closing prices exceeding the EMA20 and EMA50 values. Technical interpretation indicates possible positive short to medium term momentum.
Support and Resistance
| Zone Type | Zone From | Zone To | Direction |
|---|---|---|---|
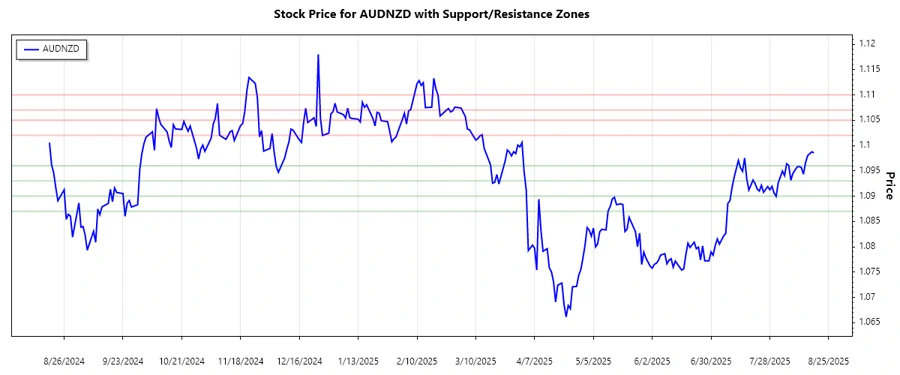
| Support | 1.087 | 1.090 | ⬇️ |
| Support | 1.093 | 1.096 | ⬇️ |
| Resistance | 1.102 | 1.105 | ⬆️ |
| Resistance | 1.107 | 1.110 | ⬆️ |
The current exchange rate is hovering around the identified support zone (1.093 - 1.096). If this support holds, it could act as a springboard for upward momentum.
Conclusion
The AUDNZD currency pair's recent performance points to a short-term uptrend, with potential for continued gains if key support levels remain steady. However, the proximity to resistance levels suggests investors should be vigilant. Upcoming economic indicators and geopolitical factors could heavily influence potential reversals or continuations in trend dynamics. Risk management should be prioritized given the current volatility, and market participants should prepare for either scenario.
Smart Data Insight
Master the Perfect Entry & Exit for this Stock
Don't leave your profits to chance. Historically, this stock follows specific seasonal patterns that institutional traders use to maximize returns.
- ✅ Identify the "Golden Buying Window"
- ✅ Avoid high-risk correction cycles
- ✅ Backtested data from the last 20+ years