March 21, 2026 a 05:08 am

AUDNZD: Fibonacci Analysis
The AUDNZD currency pair has shown significant movements in recent times. With Australia and New Zealand being closely tied in trading relations, their currencies often reflect changes in economic indicators and policy decisions. Recently, the AUDNZD has experienced fluctuations due to varying trade data and interest rate decisions from both countries. Understanding the technical levels for this pair can provide crucial insights into potential price movements.
Fibonacci Analysis
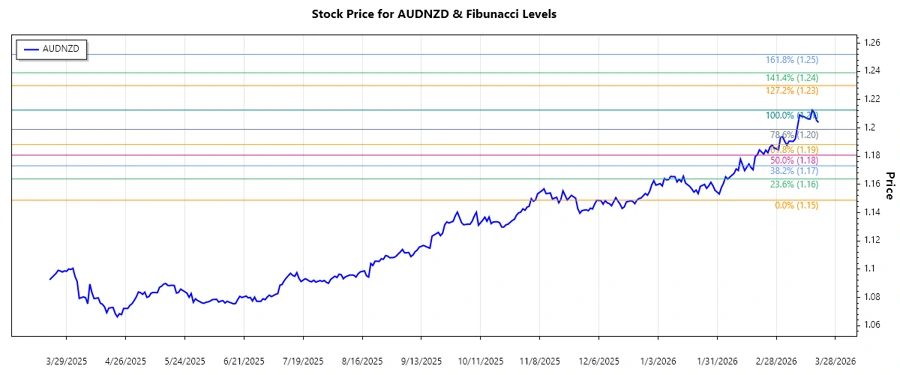
The recent trend observed in AUDNZD is a dominant uptrend, starting from early January 2026 to mid-March 2026. The price rallied from a low to a high, marking significant levels that can guide future price action expectations.
| Details | Value |
|---|---|
| Trend Start Date | 2025-12-25 |
| Trend End Date | 2026-03-20 |
| High Point Date | 2026-03-18 |
| High Point Price | 1.21262 |
| Low Point Date | 2025-12-25 |
| Low Point Price | 1.14879 |
| Fibonacci Level | Price Level |
|---|---|
| 0.236 | 1.1777 |
| 0.382 | 1.1845 |
| 0.5 | 1.1927 |
| 0.618 | 1.2009 |
| 0.786 | 1.2118 |
The current price is around 1.20389, which places it in the 0.618 Fibonacci retracement zone. This level often acts as a strong support or resistance.
Technical analysis suggests the price might find it challenging to break past this level without additional bullish momentum. If the price rebounds at 0.618, it could signify strong underlying bullish sentiment.
Conclusion
The Fibonacci analysis of the AUDNZD suggests that the currency pair has reached a potential support level. While the price is in the 0.618 retracement zone, a critical area for traders, the pair must break above to continue its uptrend confidently. If the support holds, the AUDNZD might rally back to test its previous high. Conversely, failure to hold above this level might induce a short-term bearish correction. Analysts should watch for confirmation of price action around this zone to gauge the future direction of the currency.