November 17, 2025 a 05:08 am

AUDNZD: Fibonacci Analysis
The AUDNZD currency pair has recently experienced notable shifts, with its latest movements suggesting strong investor interest. Observing the price trend and market sentiment, traders and analysts should consider recent economic indicators from both Australia and New Zealand. A detailed analysis is crucial to understanding potential support and resistance levels.
Fibonacci Analysis
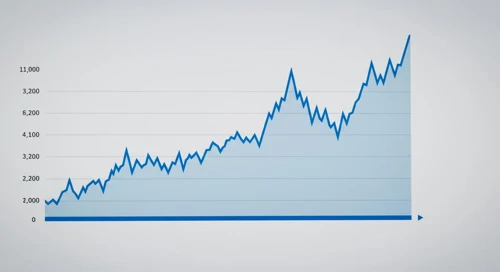
Based on the provided data, AUDNZD has been in an upward trend. The recent high was on 2025-11-11 with a price of 1.15782, and the low was on 2025-07-07 with a price of 1.08265.
| Trend Start Date | Trend End Date | High Price and Date | Low Price and Date |
|---|---|---|---|
| 2025-07-07 | 2025-11-11 | 1.15782 on 2025-11-11 | 1.08265 on 2025-07-07 |
| Fibonacci Level | Price Level |
|---|---|
| 0.236 | 1.10089 |
| 0.382 | 1.11622 |
| 0.5 | 1.12024 |
| 0.618 | 1.13035 |
| 0.786 | 1.14567 |
The current price of AUDNZD is 1.15084, which is above the 0.786 Fibonacci retracement level, indicating a continuation of the bullish trend. This suggests a strong support level at this point might provide a basis for further upward momentum.
Conclusion
The upward trend in AUDNZD suggests resilient growth, powered by positive economic signals. However, potential global economic disruptions remain a risk factor. Analysts focusing on the AUDNZD should monitor geopolitical developments and trade agreements that could impact currency valuations. Ultimately, understanding technical signals alongside fundamental analysis can provide a well-rounded view of the market potential for this currency pair.
Smart Data Insight
Master the Perfect Entry & Exit for this Stock
Don't leave your profits to chance. Historically, this stock follows specific seasonal patterns that institutional traders use to maximize returns.
- ✅ Identify the "Golden Buying Window"
- ✅ Avoid high-risk correction cycles
- ✅ Backtested data from the last 20+ years