October 11, 2025 a 05:08 am

AUDNZD: Fibonacci Analysis
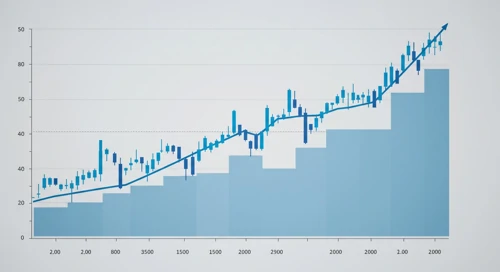
The AUDNZD currency pair has demonstrated significant volatility over the past few months, indicating a responsive market environment with potential trading opportunities. Observing the recent trend, we have identified a dominant uptrend stretching back several weeks, showcasing defined levels of support and resistance that traders could strategically exploit. Such analysis aids in predicting potential reversals or continuations within the market.
Fibonacci Analysis
| Trend Period | High Date | High Price | Low Date | Low Price |
|---|---|---|---|---|
| 2024-11-22 to 2025-09-30 | 2025-09-30 | 1.1404 | 2025-08-20 | 1.09435 |
Fibonacci Levels
| Level | Price |
|---|---|
| 0.236 | 1.12842 |
| 0.382 | 1.12146 |
| 0.5 | 1.11737 |
| 0.618 | 1.11328 |
| 0.786 | 1.10713 |
The current price is at 1.13112, which is above the 0.236 retracement level, suggesting the possibility of a continued upward trend or a test of this level as support.
Technically, if the price holds, the 0.236 level could act as a new support, pointing to further bullish momentum.
Conclusion
The AUDNZD currency pair has shown a strong bullish trend, with recent price action confirming higher highs and lows, indicative of sustained upward pressure. However, traders should remain vigilant of potential pullbacks, especially at key Fibonacci levels, which may offer buying opportunities if the uptrend were to resume. The risk remains that a failure to uphold support levels might signal a trend reversal. Therefore, while opportunities for gains exist, caution and strategic entry are advised.
Smart Data Insight
Master the Perfect Entry & Exit for this Stock
Don't leave your profits to chance. Historically, this stock follows specific seasonal patterns that institutional traders use to maximize returns.
- ✅ Identify the "Golden Buying Window"
- ✅ Avoid high-risk correction cycles
- ✅ Backtested data from the last 20+ years