September 29, 2025 a 05:08 am
AUDNZD: Fibonacci Analysis
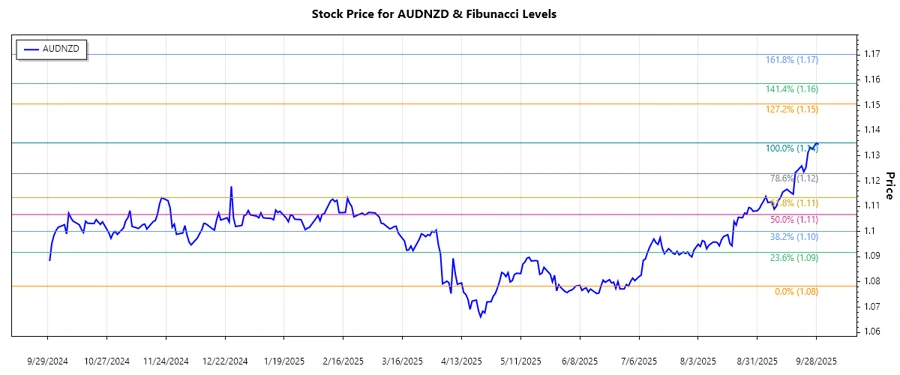
The AUDNZD currency pair has exhibited significant fluctuations over the past few months, with a notable dominant uptrend establishing itself. The Australian dollar's strength against the New Zealand dollar can be contributed to economic data or geopolitical influences that favored the AUD. Investors should consider this trend carefully as it signifies potential opportunities for entry points using the Fibonacci retracement levels.
Fibunacci Analysis
| Trend Period | Trend Details |
|---|---|
| Start Date | 2025-07-01 |
| End Date | 2025-09-29 |
| High Price | 1.13514 on 2025-09-28 |
| Low Price | 1.07835 on 2025-07-01 |
| Fibonacci Level | Price Level |
|---|---|
| 0.236 | 1.09357 |
| 0.382 | 1.10212 |
| 0.5 | 1.10674 |
| 0.618 | 1.11136 |
| 0.786 | 1.11830 |
Currently, the price is experiencing fluctuations within the 0.236 to 0.382 Fibonacci retracement levels, indicating potential support around this zone. This condition suggests that as long as the price holds above these levels, the overall uptrend might continue.
The recent consolidation in the 0.236 to 0.382 zone acts as a possible support, providing an opportunity for traders to consider a continuation of the trend or prepare for potential changes.
Conclusion
The AUDNZD pair continues to exhibit strength in its upward momentum. The analysis of Fibonacci retracement levels suggests that investors should monitor the 0.236 to 0.382 levels closely as a potential support. Should the economic conditions remain favorable for the Australian dollar, the uptrend may continue. However, if market conditions change, a retracement below the 0.382 level might signal a potential reversal or more significant correction. In summary, traders should weigh their strategies considering both the technical indicators and the broader economic context.
Smart Data Insight
Master the Perfect Entry & Exit for this Stock
Don't leave your profits to chance. Historically, this stock follows specific seasonal patterns that institutional traders use to maximize returns.
- ✅ Identify the "Golden Buying Window"
- ✅ Avoid high-risk correction cycles
- ✅ Backtested data from the last 20+ years