April 29, 2026 a 04:28 am
AUDJPY: Trend and Support & Resistance Analysis
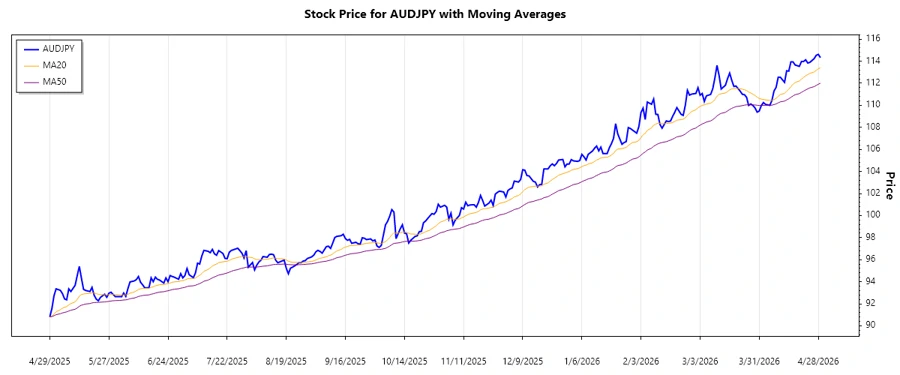
The AUDJPY pair has shown significant movements over the past few months. The recent data indicates a noticeable upwards trend, especially in the past few weeks. Traders should be mindful of the support and resistance levels as they reflect crucial price points. The technical analysis will shed light on these developments.
Trend Analysis
| Date | Close Price | Trend |
|---|---|---|
| 2026-04-29 | 114.317 | ▲ Uptrend |
| 2026-04-28 | 114.616 | ▲ Uptrend |
| 2026-04-27 | 114.534 | ▲ Uptrend |
| 2026-04-26 | 114.23 | ▲ Uptrend |
| 2026-04-24 | 113.894 | ▲ Uptrend |
| 2026-04-23 | 113.83 | ▲ Uptrend |
| 2026-04-22 | 114.129 | ▲ Uptrend |
The AUDJPY pair is currently observing an ▲ Uptrend as indicated by the closing prices over the last few days. This is supported by EMA calculations that confirm the current bullish movement. Traders should consider these trends for their strategies.
Support- and Resistance
| Zone Type | From | To |
|---|---|---|
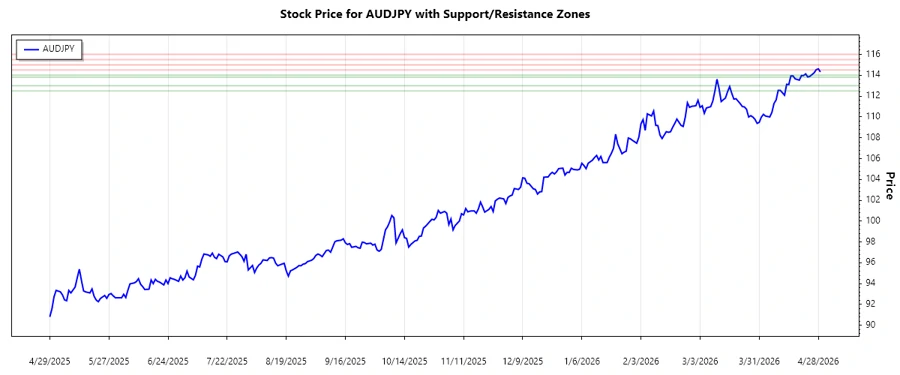
| Support Zone | 113.80 | 114.00 |
| Support Zone | 112.50 | 113.00 |
| Resistance Zone | 114.50 | 115.00 |
| Resistance Zone | 115.50 | 116.00 |
The current price-action sits near the upper band of a resistance zone, suggesting a potential breakout or reversal. Investors should be attentive to these levels as potential entry or exit points.
Conclusion
The AUDJPY currency pair appears to be positioned for an upside breakout, yet traders should carefully watch crucial resistance levels. The overall uptrend presents opportunities, although potential retracement around resistance zones must be considered as a risk factor. As market conditions evolve, monitoring key support and resistance zones will aid in better decision-making applicable to this currency pair.
json In the HTML, you can see a detailed trend and support & resistance analysis encoded within carefully structured elements that allow for quick integration into existing webpages. The JSON export is a straightforward summary of the zones and trends for further programmatic use.