March 13, 2026 a 04:28 am
AUDJPY: Trend and Support & Resistance Analysis
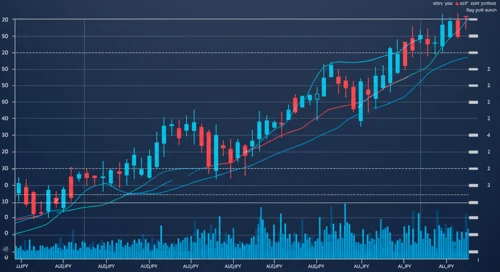
The AUDJPY currency pair has shown significant volatility over the analyzed period. Recent data suggests a strong recovery from previous lows, with a dominant upward trend in the short term. Technical indicators, such as the EMA20 crossing over the EMA50, reinforce a bullish outlook. Investors should be mindful of potential resistance zones that could impact further gains.
Trend Analysis
| Date | Closing Price | Trend |
|---|---|---|
| 2026-03-13 | 112.525 | ▲ Uptrend |
| 2026-03-12 | 112.698 | ▲ Uptrend |
| 2026-03-11 | 113.621 | ▲ Uptrend |
| 2026-03-10 | 112.473 | ▲ Uptrend |
| 2026-03-09 | 111.499 | ▲ Uptrend |
| 2026-03-08 | 110.985 | ▲ Uptrend |
| 2026-03-06 | 110.859 | ▲ Uptrend |
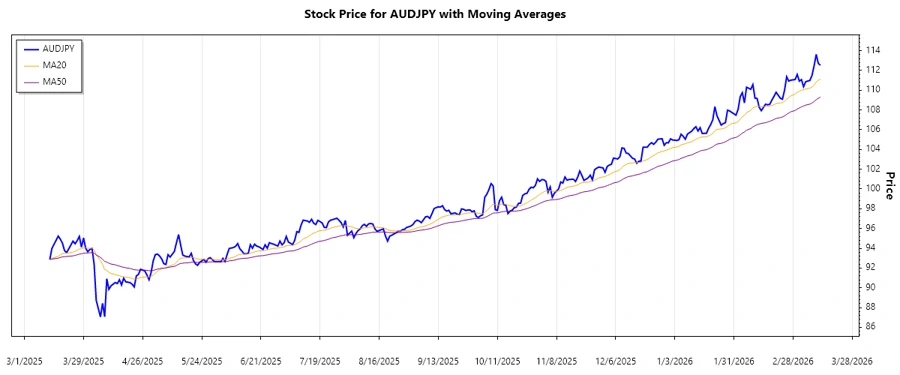
The current trend of the AUDJPY is predominantly bullish, as indicated by multiple indicators aligning with a positive sentiment. The crossing of the EMA20 above the EMA50 further validates this upward momentum.
Support and Resistance
| Zone Type | Level From | Level To |
|---|---|---|
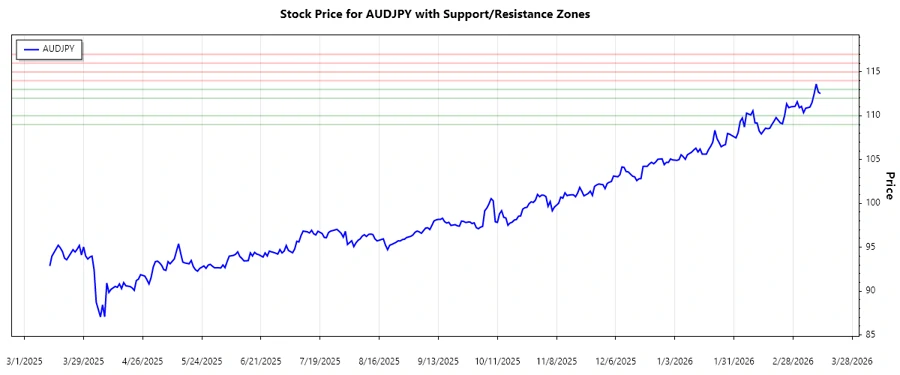
| Support Zone 1 | 109.00 | 110.00 |
| Support Zone 2 | 112.00 | 113.00 |
| Resistance Zone 1 | 114.00 | 115.00 |
| Resistance Zone 2 | 116.00 | 117.00 |
Currently, the AUDJPY is nearing the upper limit of the support zone, indicating potential for further upward movement. However, the proximity to resistance levels requires caution.
Conclusion
The AUDJPY has embarked on a notable upward trend, driven by positive technical indicators and strong support levels. While the bullish sentiment prevails, awareness of looming resistance zones is crucial to navigate potential price barriers. Investors can capitalize on the favorable trend while remaining cautious about sudden reversals that may emerge at key resistance points.