August 30, 2025 a 04:28 am

AUDJPY: Trend and Support & Resistance Analysis
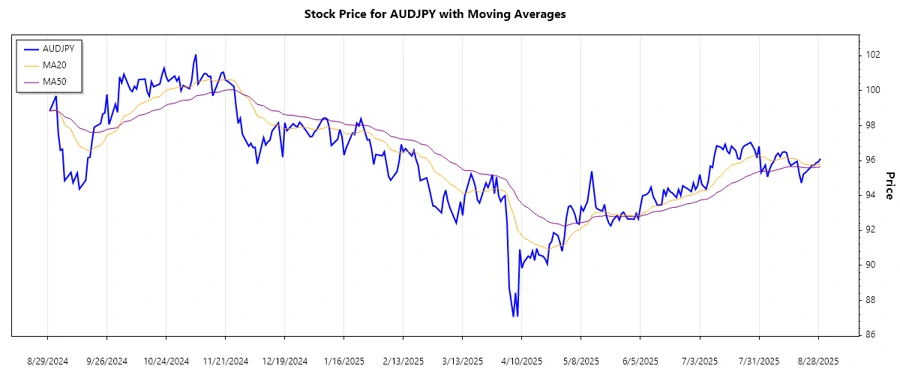
The AUDJPY currency pair has shown considerable volatility over the past months. Recently, the data suggests a stabilization pattern with both upward and downward fluctuations. Technical indicators such as moving averages depict a nuanced narrative that can be of interest to traders and analysts. Support and resistance levels are crucial in contextualizing potential price movements. Understanding these dynamics can aid in making informed trading decisions.
Trend Analysis
| Date | Close Price | Trend |
|---|---|---|
| 2025-08-29 | 96.106 | ▲ Uptrend |
| 2025-08-28 | 95.917 | ▲ Uptrend |
| 2025-08-27 | 95.873 | ▲ Uptrend |
| 2025-08-26 | 95.718 | ▼ Downtrend |
| 2025-08-25 | 95.734 | ▲ Uptrend |
| 2025-08-24 | 95.56 | ▼ Downtrend |
| 2025-08-22 | 95.324 | ▼ Downtrend |
Currently, the short-term EMA20 is above the EMA50 indicating a mild uptrend, though slight fluctuations have been observed, suggesting caution. The chart is depicted below for a better understanding of the trend dynamics.
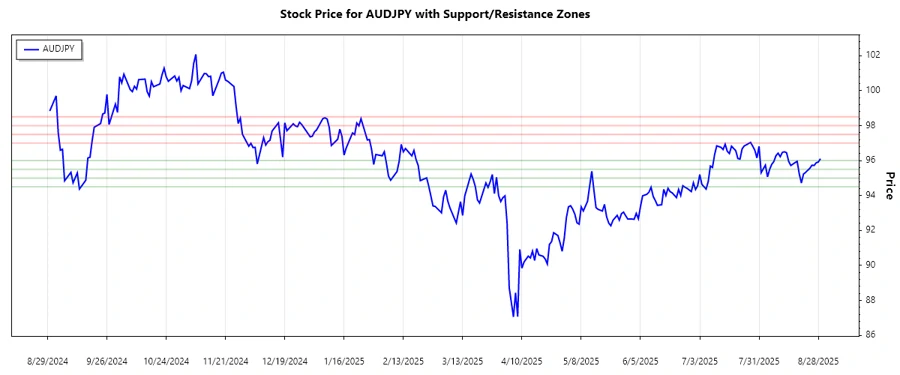
Support and Resistance
| Zone Type | From | To |
|---|---|---|
| Support 1 | 94.50 | 95.00 |
| Support 2 | 95.50 | 96.00 |
| Resistance 1 | 97.00 | 97.50 |
| Resistance 2 | 98.00 | 98.50 |
The current price appears to be near the second support zone, which can provide a cushion against potential price drops. Analysts should closely observe these levels to strategize entry and exit points effectively.
Conclusion
The AUDJPY has demonstrated an equilibrium between up-and-down movements. Short-term indicators show a slight uptrend with notable support and resistance zones providing crucial guidance. While the EMA analysis suggests an uptrend, it's essential to factor in external economic indicators that might affect currency price movements. The support and resistance levels indicate potential price behavior, vital for trading decisions. Given the current landscape, opportunities remain for gains, though mindful surveillance of economic trends is advised for risk management.
Smart Data Insight
Master the Perfect Entry & Exit for this Stock
Don't leave your profits to chance. Historically, this stock follows specific seasonal patterns that institutional traders use to maximize returns.
- ✅ Identify the "Golden Buying Window"
- ✅ Avoid high-risk correction cycles
- ✅ Backtested data from the last 20+ years