March 24, 2026 a 05:08 am
AUDJPY: Fibonacci Analysis
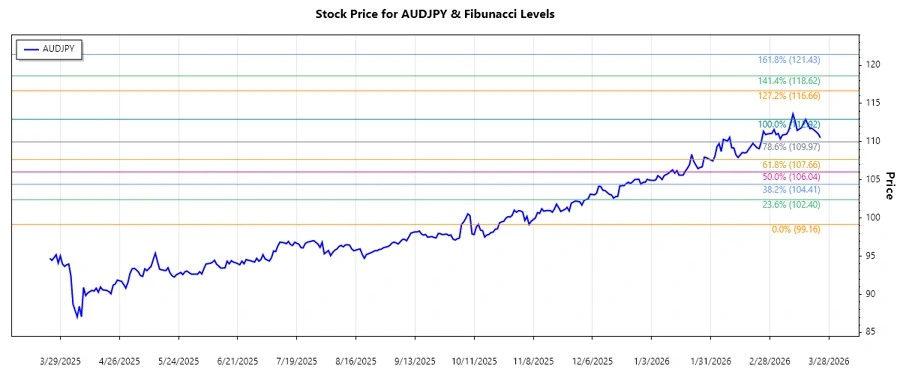
The AUD/JPY exchange rate has been experiencing an upward trend over recent months. The Australian dollar showed strength against the Japanese yen, reaching new heights with consistent bullish momentum. As the currency pair approaches key resistance levels, investors are keenly watching potential retracements for viable trading opportunities.
Fibonacci Analysis
| Detail | Value |
|---|---|
| Trend Start Date | 2025-11-05 |
| Trend End Date | 2026-03-23 |
| High Price | 112.92 (2026-03-17) |
| Low Price | 99.155 (2025-11-06) |
Fibonacci Levels
| Level | Price |
|---|---|
| 0.236 | 102.246 |
| 0.382 | 105.826 |
| 0.5 | 108.038 |
| 0.618 | 110.250 |
| 0.786 | 113.080 |
Currently, the AUDJPY is within the 0.618 retracement level, which may act as a support zone.
The current price action within this Fibonacci level suggests potential consolidation or a reversal point, indicating a prudent opportunity for traders looking for long positions.
Conclusion
The AUD/JPY pair has demonstrated a robust upward trend but faces significant resistance near the 112.92 level. The observed Fibonacci retracement levels provide potential entry points for traders looking to capitalize on any dips back to the .618 zone, currently acting as a support level. Analysts should be cautious of potential reversals, especially if the rate breaches below the 0.5 retracement level. A sustained move beyond the current highs could herald further gains, while rejection could signal room for further consolidation. Both bulls and bears will be eyeing key levels for strategic trading opportunities.