December 11, 2025 a 05:08 am
AUDJPY: Fibonacci Analysis
The AUDJPY currency pair has demonstrated volatility over recent months. Influenced by a mixture of economic data from Australia and Japan, the currency has experienced shifts driven by interest rate decisions and trade dynamics. Understanding the technical patterns, such as Fibonacci levels, is essential to anticipate potential reversal points. Currently, traders need to strategize carefully, considering support and resistance zones as identified by recent price trends.
Fibonacci Analysis
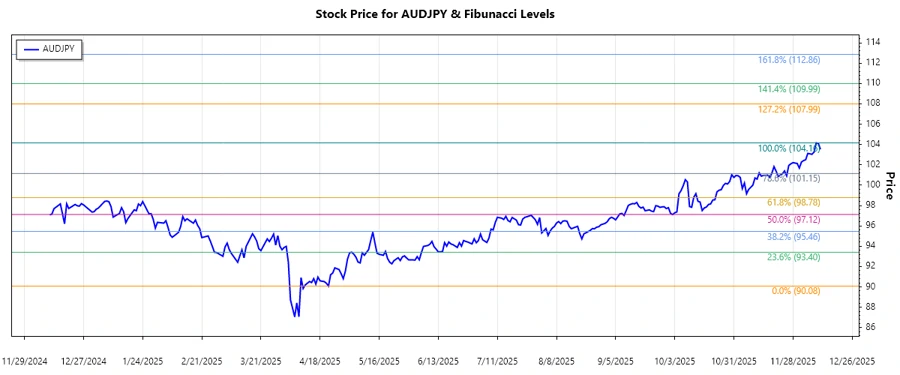
Based on the historical data analysis for the AUDJPY currency pair, an upward trend was identified. This trend started in August 2025 and peaked in early December 2025. Key Fibonacci retracement levels have been calculated using the high and low price points during this period.
| Details | Information |
|---|---|
| Trend Start Date | 2025-08-01 |
| Trend End Date | 2025-12-10 |
| Highest Price (Date) | 104.158 (2025-12-09) |
| Lowest Price (Date) | 90.081 (2025-04-22) |
| Fibonacci Level | Price Level |
|---|---|
| 0.236 | 94.277 |
| 0.382 | 97.423 |
| 0.5 | 99.986 |
| 0.618 | 102.549 |
| 0.786 | 105.714 |
As of the most recent data, the current price is 103.525, placing it within the 0.618 retracement range. This indicates a potential support zone, suggesting a likelihood of a price rebound, barring any major economic shifts.
Conclusion
The current analysis of the AUDJPY shows that the currency is flirting with significant Fibonacci retracement levels. Such levels are often seen as natural areas of support and resistance within a trend. From a technical perspective, should the price hold above the 0.618 level, we might see continued bullish pressure. Conversely, should it break below, it could signify a deeper correction. Traders should remain cautious and consider external economic factors that might impact these technical levels, as any significant economic event could disrupt these patterns.