November 21, 2025 a 05:08 am

AUDJPY: Fibonacci Analysis
The Australian Dollar to Japanese Yen (AUDJPY) currency pair has exhibited an upward trend in recent months. With growing investor confidence, the currency pair has shown resilience amid global economic fluctuations. As we analyze its trajectory, we find notable support and resistance levels that could inform future trading strategies.
Fibonacci Analysis
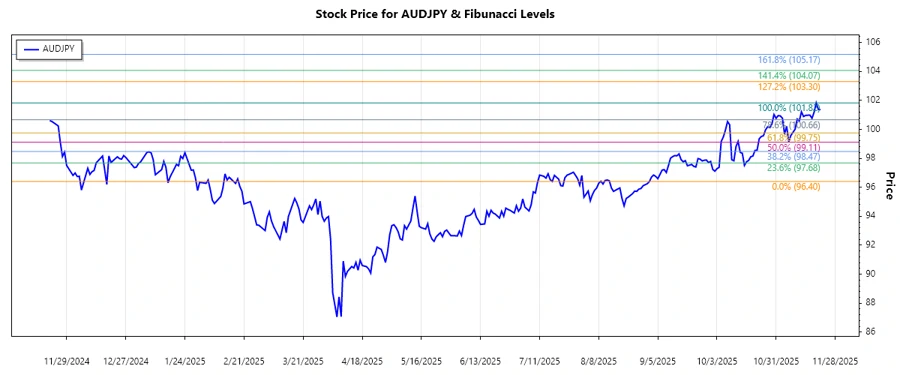
In our detailed analysis of AUDJPY, based on historical data from September to November 2025, we observe a strong upward trend. The low point occurred on September 1, 2025, at 96.401, and the high point was reached on November 19, 2025, at 101.823.
| Attribute | Details |
|---|---|
| Trend Start Date | 2025-09-01 |
| Trend End Date | 2025-11-19 |
| Trend High Price | 101.823 (on 2025-11-19) |
| Trend Low Price | 96.401 (on 2025-09-01) |
The computed Fibonacci levels based on this range are:
| Fibonacci Level | Price |
|---|---|
| 0.236 | 97.694 |
| 0.382 | 98.766 |
| 0.5 | 99.112 |
| 0.618 | 100.145 |
| 0.786 | 101.030 |
Currently, the price of AUDJPY is around 101.372, which suggests it has moved past the 0.786 retracement level. This indicates a strong resistance break, and the currency is now in a new upward zone.
Technically speaking, this result suggests a continued upward momentum, with possible new resistance forming at higher price points.
Conclusion
The AUDJPY currency pair's current positioning above the 0.786 Fibonacci retracement level provides a bullish outlook with potential for further gains. Traders should note that, while the upward trend is strong, attention must be paid to geopolitical and economic news that can influence volatility. This analysis signals opportunities for buying on dips, while also being mindful of resistance levels formed during market corrections. Overall, the AUDJPY continues to present an attractive prospect for those willing to navigate its market dynamics.
### JSON Representation
Smart Data Insight
Master the Perfect Entry & Exit for this Stock
Don't leave your profits to chance. Historically, this stock follows specific seasonal patterns that institutional traders use to maximize returns.
- ✅ Identify the "Golden Buying Window"
- ✅ Avoid high-risk correction cycles
- ✅ Backtested data from the last 20+ years