September 08, 2025 a 05:08 am
AUDJPY: Fibonacci Analysis
The AUD/JPY currency pair has shown significant movements over recent months, driven by economic indicators and geopolitical factors. Understanding these trends is essential for traders seeking to capitalize on potential opportunities or to mitigate risks. As we delve into technical analysis, we will use Fibonacci retracement levels to understand potential support and resistance areas, which might influence future price action.
Fibonacci Analysis
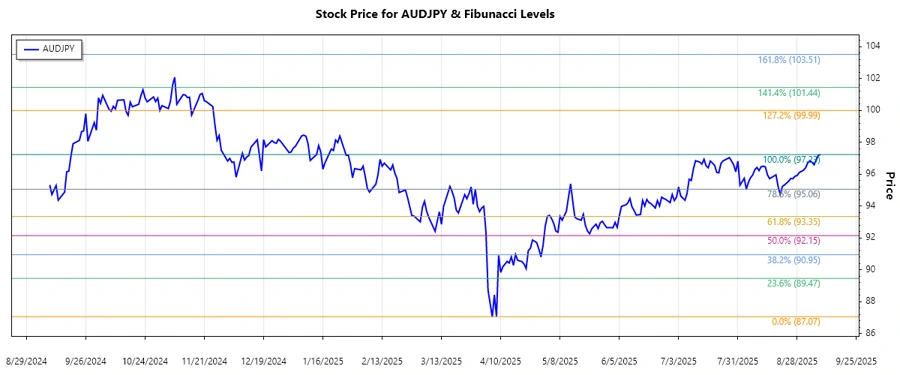
This analysis looks at historical data to identify the latest significant trend, setting up a Fibonacci retracement study to frame future price predictions. The latest dominant trend in AUDJPY is an upward trend, showing an increase in the price over the past few months. Below are the critical retracement levels based on this trend:
| Trend Details | Values |
|---|---|
| Start Date | 2024-04-08 |
| End Date | 2025-09-08 |
| High Price | 97.23 on 2025-09-08 |
| Low Price | 87.069 on 2025-04-08 |
Fibonacci Retracement Levels
| Level | Price |
|---|---|
| 0.236 | 89.68 |
| 0.382 | 91.62 |
| 0.500 | 92.79 |
| 0.618 | 93.96 |
| 0.786 | 95.28 |
Currently, the price is very close to its previous highest level and has not yet entered a clear retracement zone. As such, it indicates that previous resistance levels may become strong support if retracements occur. Should the trend reverse within these retracement zones, traders could find potential entry or exit points based on these Fibonacci levels.
Conclusion
In conclusion, the AUD/JPY pair displays an upward trend supported by consistent economic factors. Traders should consider Fibonacci levels as potential support and resistance zones, impacting trading strategies. While the price remains near its high, a watchful approach is vital for identifying emerging price action signals. For aspiring analysts, understanding these technical indicators offers a substantial edge in anticipating market movements, balancing both opportunities and risks.
Smart Data Insight
Master the Perfect Entry & Exit for this Stock
Don't leave your profits to chance. Historically, this stock follows specific seasonal patterns that institutional traders use to maximize returns.
- ✅ Identify the "Golden Buying Window"
- ✅ Avoid high-risk correction cycles
- ✅ Backtested data from the last 20+ years