
June 30, 2026 a 04:28 am
AUDCAD: Trend and Support & Resistance Analysis
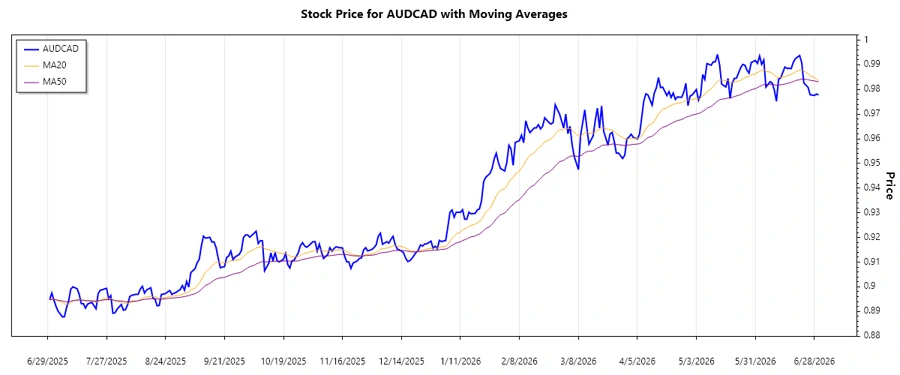
The AUDCAD pair demonstrates a complex price action pattern with a recent upward movement characterized by volatility. Keysupport and resistance levels provide critical insight into possible future price movements. Monitoring these zones is crucial for traders aiming to make informed decisions.
Trend Analysis
| Date | Closing Price | Trend |
|---|---|---|
| 2026-06-30 | 0.97779 | ▲ Uptrend |
| 2026-06-29 | 0.97816 | ▲ Uptrend |
| 2026-06-28 | 0.97758 | ▲ Uptrend |
| 2026-06-26 | 0.97786 | ▲ Uptrend |
| 2026-06-25 | 0.98088 | ▲ Uptrend |
| 2026-06-24 | 0.98174 | ▲ Uptrend |
| 2026-06-23 | 0.98266 | ▲ Uptrend |
The calculation of EMA20 and EMA50 indicates an upward trajectory, signifying a bullish trend in the short term.
Support and Resistance
| Zone Type | From | To |
|---|---|---|
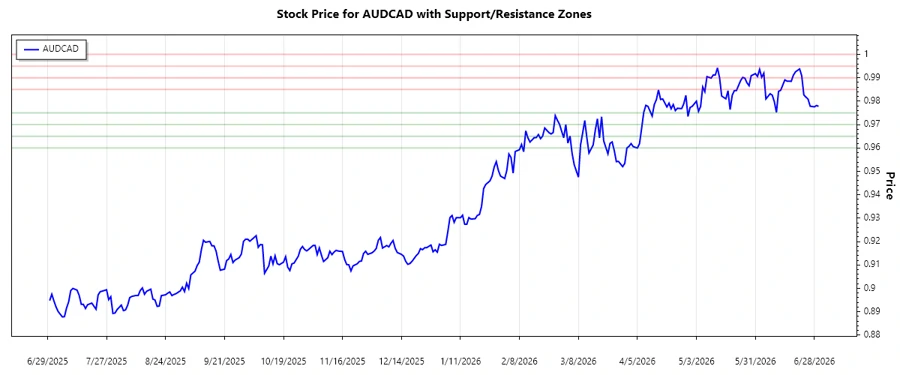
| Support | 0.97000 | 0.97500 |
| Support | 0.96000 | 0.96500 |
| Resistance | 0.98500 | 0.99000 |
| Resistance | 0.99500 | 1.00000 |
The current price hovers near a support zone, indicating potential buying pressure and opportunity for upside movement.
Conclusion
The AUDCAD currency pair currently exhibits an upward trend, supported by bullish indicators in the short-term moving averages. While key resistance levels could pose challenges, the currency pair remains in a strong position provided current support levels hold. The potential for profit remains significant, yet traders should remain vigilant for signs of trend reversal.
Smart Data Insight
Master the Perfect Entry & Exit for this Stock
Don't leave your profits to chance. Historically, this stock follows specific seasonal patterns that institutional traders use to maximize returns.
- ✅ Identify the "Golden Buying Window"
- ✅ Avoid high-risk correction cycles
- ✅ Backtested data from the last 20+ years