
June 20, 2026 a 04:28 am

AUDCAD: Trend and Support & Resistance Analysis
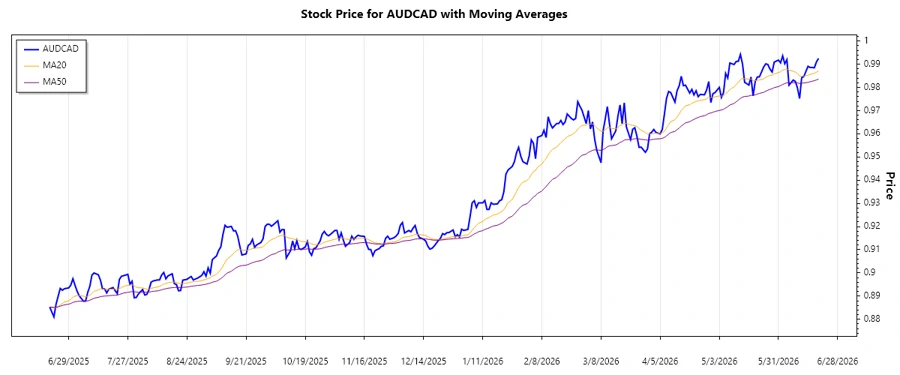
The AUDCAD currency pair demonstrates a recent ascending trend. Last week's analysis indicates an increasing momentum primarily driven by potential market optimism and favorable economic data from Australia. This rally could encourage currency traders to pay closer attention as the trend persists. However, caution is advised due to potential volatility.
Trend Analysis
| Date | Close Price | Trend |
|---|---|---|
| 2026-06-19 | 0.99252 | ▲ Upward |
| 2026-06-18 | 0.99102 | ▲ Upward |
| 2026-06-17 | 0.98847 | ▲ Upward |
| 2026-06-16 | 0.98858 | ▲ Upward |
| 2026-06-15 | 0.98856 | ▲ Upward |
| 2026-06-14 | 0.98911 | ▲ Upward |
| 2026-06-12 | 0.98466 | ▲ Upward |
The EMA analysis shows a distinct upward trend with EMA20 surpassing EMA50. This trend showcases strong bullish momentum, suggesting continuation unless contrary indicators arise.
Support and Resistance
| Zone | Range | Type |
|---|---|---|
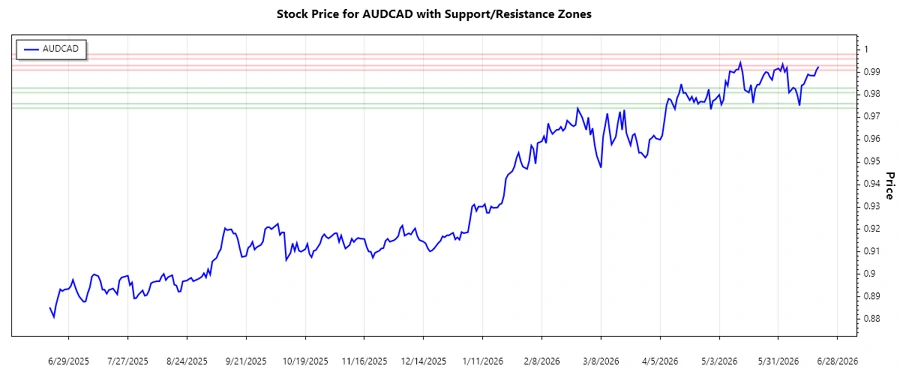
| Support Zone 1 | 0.97400 - 0.97600 | ▼ Support |
| Support Zone 2 | 0.98100 - 0.98300 | ▼ Support |
| Resistance Zone 1 | 0.99100 - 0.99300 | ▲ Resistance |
| Resistance Zone 2 | 0.99600 - 0.99800 | ▲ Resistance |
The current price resides near a resistance zone, cautioning potential bearish reversal. Traders should closely observe price action in this area for signs of breakout or reversal.
Conclusion
The AUDCAD pair exhibits a solid bullish trend with potential continuation. Immediate resistance may provoke a temporary pause or correction, but should momentum persist, further gains are conceivable. Investors should remain vigilant of economic announcements and data affecting either the Australian or Canadian economies. Tailoring trading strategies to include protective stops could mitigate adverse market shifts.
Smart Data Insight
Master the Perfect Entry & Exit for this Stock
Don't leave your profits to chance. Historically, this stock follows specific seasonal patterns that institutional traders use to maximize returns.
- ✅ Identify the "Golden Buying Window"
- ✅ Avoid high-risk correction cycles
- ✅ Backtested data from the last 20+ years