November 12, 2025 a 04:28 am


AUDCAD: Trend and Support & Resistance Analysis
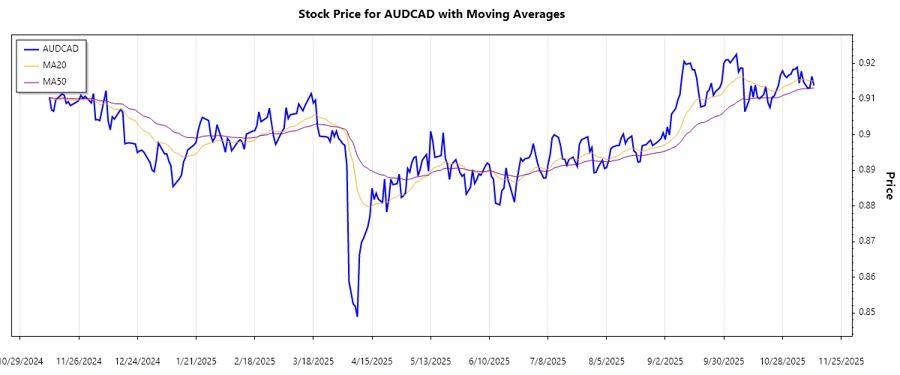
The AUDCAD currency pair has been on a subtle upward trend, with observable fluctuations. Recent movements suggest a stabilization near certain resistance levels. Traders should closely monitor key support zones for potential entry points as volatility may present both opportunities and risks.
Trend Analysis
An analysis of the AUDCAD price movements reveals fluctuations over the past months. Calculating the 20-day and 50-day Exponential Moving Averages (EMAs) is essential to understanding the current trend. The EMA20 crossing above EMA50 indicates an upward trend, while the opposite suggests a downward trend.
| Date | Close Price | Trend |
|---|---|---|
| 2025-11-12 | 0.91379 | ▲ |
| 2025-11-11 | 0.91635 | ▲ |
| 2025-11-10 | 0.9131 | ▲ |
| 2025-11-09 | 0.91306 | ▲ |
| 2025-11-07 | 0.91482 | ▲ |
| 2025-11-06 | 0.91778 | ▲ |
| 2025-11-05 | 0.91442 | ▲ |
Trend assessment shows a consistent upward direction in recent days, suggesting sustained bullish momentum.
Support and Resistance
Based on historical price data, significant support and resistance zones can be identified. These levels help traders understand potential price reversal or breakout points.
| Zone Type | From | To |
|---|---|---|
| Support | 0.90800 | 0.91000 |
| Support | 0.91300 | 0.91500 |
| Resistance | 0.91800 | 0.92000 |
| Resistance | 0.92200 | 0.92400 |
The current price trades near a resistance zone at 0.91800 to 0.92000. A breakout above this level could signal further bullish moves.
Conclusion
In conclusion, the AUDCAD pair is demonstrating signs of a bullish trend, with prices nearing resistance zones. Traders should consider the potential for breakouts as well as corrections. While upward momentum is present, careful monitoring of support zones is crucial to mitigate risks. Overall, the pair presents opportunities for traders looking for upward movements, although caution is advised to prevent unfavorable entries.
Smart Data Insight
Master the Perfect Entry & Exit for this Stock
Don't leave your profits to chance. Historically, this stock follows specific seasonal patterns that institutional traders use to maximize returns.
- ✅ Identify the "Golden Buying Window"
- ✅ Avoid high-risk correction cycles
- ✅ Backtested data from the last 20+ years