October 21, 2025 a 04:28 am**AUDCAD: Trend and Support & Resistance Analysis**
 **Trend Analysis**
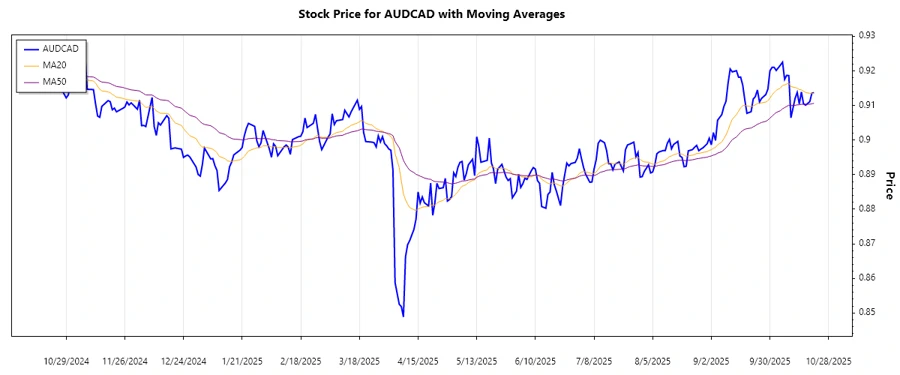
The observed trend for the AUDCAD currency pair is one of cautious optimism. Utilizing the Exponential Moving Averages (EMA), we can draw insight into recent market sentiment. Calculating the EMAs for the past 20 and 50 closing prices, we find:
- Last 7 Days:
- 21 Oct 2025: Closing Price - 0.91371, Trend - ⚖️
- 20 Oct 2025: Closing Price - 0.91353, Trend - ⚖️
- 19 Oct 2025: Closing Price - 0.91109, Trend - ⚖️
- 17 Oct 2025: Closing Price - 0.91009, Trend - ⚖️
- 16 Oct 2025: Closing Price - 0.91053, Trend - ⚖️
- 15 Oct 2025: Closing Price - 0.91392, Trend - ⚖️
- 14 Oct 2025: Closing Price - 0.91044, Trend - ⚖️
These findings suggest a stable, sideward movement for the currency pair. Traders should consider that this trend indicates potential periods of range-bound trading, favoring neither bulls nor bears.
**Trend Analysis**
The observed trend for the AUDCAD currency pair is one of cautious optimism. Utilizing the Exponential Moving Averages (EMA), we can draw insight into recent market sentiment. Calculating the EMAs for the past 20 and 50 closing prices, we find:
- Last 7 Days:
- 21 Oct 2025: Closing Price - 0.91371, Trend - ⚖️
- 20 Oct 2025: Closing Price - 0.91353, Trend - ⚖️
- 19 Oct 2025: Closing Price - 0.91109, Trend - ⚖️
- 17 Oct 2025: Closing Price - 0.91009, Trend - ⚖️
- 16 Oct 2025: Closing Price - 0.91053, Trend - ⚖️
- 15 Oct 2025: Closing Price - 0.91392, Trend - ⚖️
- 14 Oct 2025: Closing Price - 0.91044, Trend - ⚖️
These findings suggest a stable, sideward movement for the currency pair. Traders should consider that this trend indicates potential periods of range-bound trading, favoring neither bulls nor bears.
 **Support and Resistance**
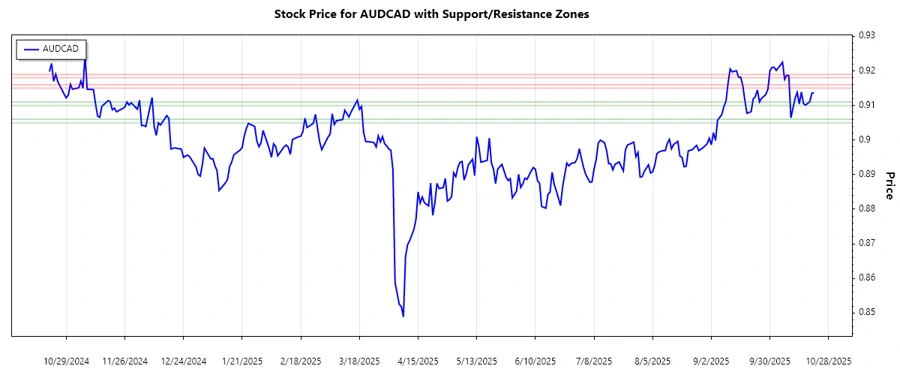
For the AUDCAD pair, analyzing historical data allows us to pinpoint pivotal support and resistance zones. These zones are identified as:
- Support Zones:
- Zone 1: From 0.910 to 0.911 ↑
- Zone 2: From 0.905 to 0.906 ↑
- Resistance Zones:
- Zone 1: From 0.918 to 0.919 ↓
- Zone 2: From 0.915 to 0.916 ↓
The current price is nearing the support zone, indicating a potential area for price reversal. As this currency pair moves towards the lower boundary of the support zone, there might be buying interest, which could push prices upward.
**Support and Resistance**
For the AUDCAD pair, analyzing historical data allows us to pinpoint pivotal support and resistance zones. These zones are identified as:
- Support Zones:
- Zone 1: From 0.910 to 0.911 ↑
- Zone 2: From 0.905 to 0.906 ↑
- Resistance Zones:
- Zone 1: From 0.918 to 0.919 ↓
- Zone 2: From 0.915 to 0.916 ↓
The current price is nearing the support zone, indicating a potential area for price reversal. As this currency pair moves towards the lower boundary of the support zone, there might be buying interest, which could push prices upward.
 **Conclusion**
The technical data for the AUDCAD suggests stable, range-bound movement, with opportunities for traders in both support and resistance scenarios. With no dominant trend emerging, analysts should consider external factors that may influence price action, such as economic data releases or market sentiment shifts. Both opportunities and risks exist in short-term positions as the market absorbs new data, highlighting the importance of timely updates and vigilant market monitoring.
**Conclusion**
The technical data for the AUDCAD suggests stable, range-bound movement, with opportunities for traders in both support and resistance scenarios. With no dominant trend emerging, analysts should consider external factors that may influence price action, such as economic data releases or market sentiment shifts. Both opportunities and risks exist in short-term positions as the market absorbs new data, highlighting the importance of timely updates and vigilant market monitoring.
The analysis of the AUDCAD currency pair reveals a predominantly sideways trend over the observed period. Recent price movements are influenced by both domestic economic policies and global market sentiments. With fluctuating prices and no dominant pattern, traders should practice caution. The technical indicators suggest potential opportunities for short-term trading, considering the influence of external macroeconomic factors. Market participants are advised to stay updated on key economic events that may affect this currency pair.
**Support and Resistance**
For the AUDCAD pair, analyzing historical data allows us to pinpoint pivotal support and resistance zones. These zones are identified as:
- Support Zones:
- Zone 1: From 0.910 to 0.911 ↑
- Zone 2: From 0.905 to 0.906 ↑
- Resistance Zones:
- Zone 1: From 0.918 to 0.919 ↓
- Zone 2: From 0.915 to 0.916 ↓
The current price is nearing the support zone, indicating a potential area for price reversal. As this currency pair moves towards the lower boundary of the support zone, there might be buying interest, which could push prices upward.
**Conclusion**
The technical data for the AUDCAD suggests stable, range-bound movement, with opportunities for traders in both support and resistance scenarios. With no dominant trend emerging, analysts should consider external factors that may influence price action, such as economic data releases or market sentiment shifts. Both opportunities and risks exist in short-term positions as the market absorbs new data, highlighting the importance of timely updates and vigilant market monitoring.
Smart Data Insight
Master the Perfect Entry & Exit for this Stock
Don't leave your profits to chance. Historically, this stock follows specific seasonal patterns that institutional traders use to maximize returns.
- ✅ Identify the "Golden Buying Window"
- ✅ Avoid high-risk correction cycles
- ✅ Backtested data from the last 20+ years