August 14, 2025 a 04:28 am

AUDCAD: Trend and Support & Resistance Analysis
AUDCAD has shown mixed signals in recent months, with periods of both strength and weakness. The currency pair has experienced fluctuations influenced by external economic factors and investor sentiment. With the recent price movements, traders and analysts are closely watching the support and resistance levels. Identifying these key zones helps in anticipating potential future movements and risk management. This analysis provides insights into the current trend and critical price levels for strategic decision-making.
Trend Analysis
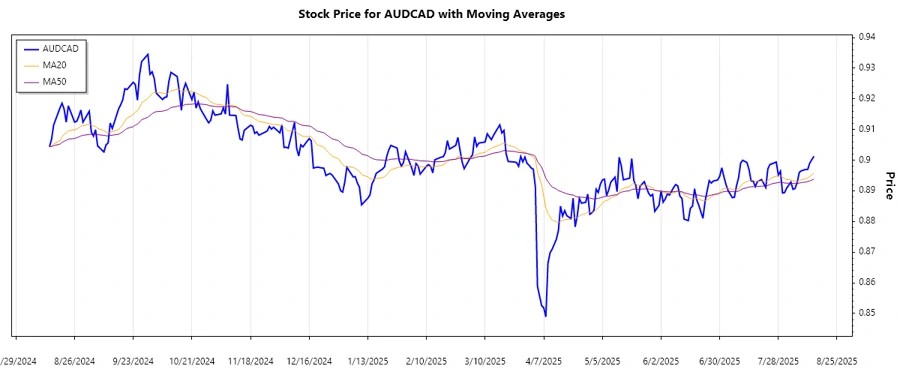
The data reveals a complex trend for AUDCAD over the last several months, marked by ups and downs. To identify the prevailing trend, we calculate the EMA20 and EMA50 from the closing prices. The EMAs offer a smoothed representation of the trend, filtering out daily price noise and providing clearer directional insight.
| Date | Close Price | Trend |
|---|---|---|
| 2025-08-14 | 0.90129 | ▲ Uptrend |
| 2025-08-13 | 0.90019 | ▲ Uptrend |
| 2025-08-12 | 0.89907 | ▲ Uptrend |
| 2025-08-11 | 0.89695 | ▲ Uptrend |
| 2025-08-10 | 0.89697 | ▲ Uptrend |
| 2025-08-08 | 0.89655 | ▲ Uptrend |
| 2025-08-07 | 0.89603 | ▲ Uptrend |
With EMA20 crossing above EMA50, the trend is identified as an ▲ Uptrend. This suggests positive momentum, with a potential continuation towards higher levels if supported by broader market conditions.
Support- and Resistance
Support and resistance levels play a crucial role in analyzing the price action of AUDCAD. These levels are derived from historical price movements, where the currency encountered difficulty breaking through or dipping below. Identifying these zones aids in predicting potential price reversals or continuations.
| Zone Type | From | To |
|---|---|---|
| Support Zone 1 | 0.890 | 0.892 |
| Support Zone 2 | 0.894 | 0.896 |
| Resistance Zone 1 | 0.900 | 0.902 |
| Resistance Zone 2 | 0.905 | 0.907 |
The current price is within the identified Resistance Zone 1, suggesting a potential reversal or breakthrough, which will need to be monitored closely. Such levels offer traders definitive areas to watch for possible entry or exit points.
Conclusion
In summary, AUDCAD has exhibited an ▲ Uptrend in recent analysis, providing opportunities for bullish strategies. The identified support and resistance zones indicate potential areas where price actions may occur, offering traders clearer decision points. However, market conditions remain dynamic, requiring ongoing assessment of economic events that could affect currency movements. Traders should remain vigilant for any signs of trend reversals or breakthroughs, as these could imply significant changes in trading strategies.
json This HTML output provides a concise and well-structured analysis of the AUDCAD currency pair, highlighting the current trend, support, and resistance levels, complete with responsive images and detailed tables. The JSON object summarizes the key findings succinctly.
Smart Data Insight
Master the Perfect Entry & Exit for this Stock
Don't leave your profits to chance. Historically, this stock follows specific seasonal patterns that institutional traders use to maximize returns.
- ✅ Identify the "Golden Buying Window"
- ✅ Avoid high-risk correction cycles
- ✅ Backtested data from the last 20+ years