March 14, 2026 a 05:08 am
AUDCAD: Fibonacci Analysis
The AUDCAD currency pair has shown a notable trend over the past months. The pair has recently exhibited a significant upward trajectory, indicating a strengthening of the Australian dollar relative to the Canadian dollar. This analysis focuses on identifying key Fibonacci retracement levels to assess potential areas of support and resistance in the current market context.
Fibonacci Analysis
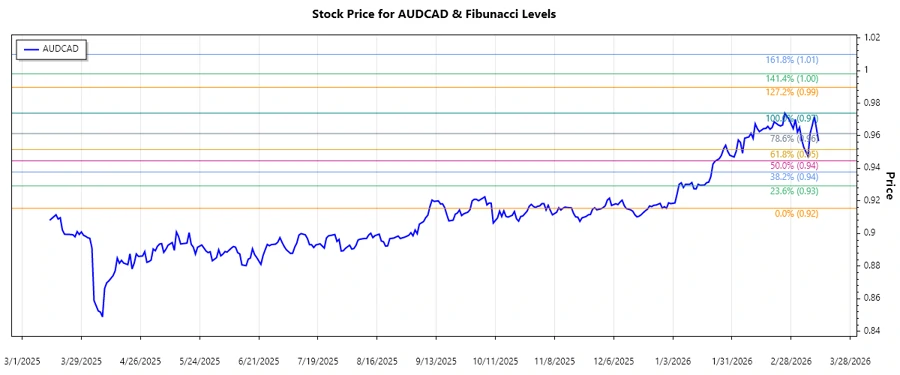
Analyzing the recent market data, we have identified a dominant upward trend starting in early January 2026. The pair reached a peak price recently, indicative of strong bullish momentum.
| Aspect | Details |
|---|---|
| Trend Start Date | 2025-12-31 |
| Trend End Date | 2026-03-13 |
| High Point (Price & Date) | 0.97383 on 2026-02-25 |
| Low Point (Price & Date) | 0.91546 on 2025-12-31 |
| Current Price | 0.95669 |
| Fibonacci Level | Price Level |
|---|---|
| 0.236 | 0.95736 |
| 0.382 | 0.94799 |
| 0.5 | 0.944645 |
| 0.618 | 0.93729 |
| 0.786 | 0.92614 |
The current price is within the 0.236 retracement level, indicating potential minor support. If this level holds, it could signal a continuation of the upward movement.
Conclusion
The AUDCAD's recent upward trend presents opportunities for long positions, especially if the price sustains above critical retracement levels. However, caution is advised as breaking below these levels could suggest deeper corrections. Analysts should closely monitor price behavior around these key zones to gauge potential market sentiment shifts and confirm reversals or continuations in the trend.