January 12, 2026 a 05:08 am
AUDCAD: Fibunacci Analysis
The AUDCAD exchange rate has displayed notable volatility in recent months. This pair reflects the economic interplay between the Australian and Canadian economies, with factors such as commodity prices and interest rate differentials playing significant roles. Recently, the AUDCAD has shown a dominant upward trend, recovering from a series of lows observed a few months prior. The technical outlook will be assessed through a Fibonacci retracement analysis to determine potential levels of support and resistance.
Fibonacci Analysis
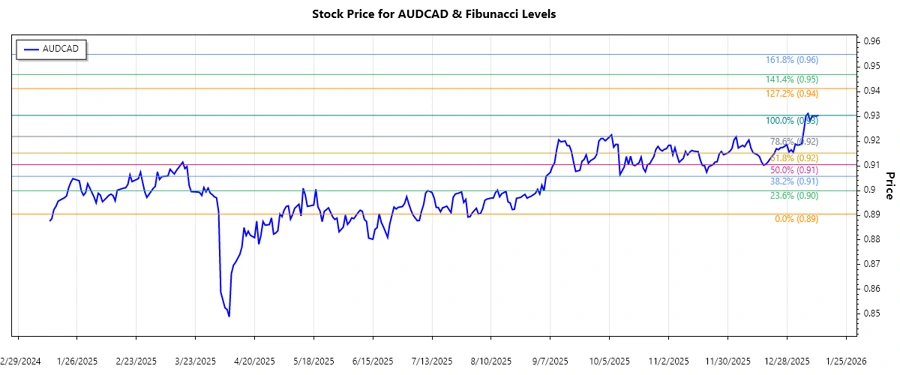
Analyzing the data from July 1, 2025, to January 12, 2026, we observe an upward trend with a significant increase from low to high. The high point was reached on January 12, 2026, at a price of 0.93043, while the low point during this period was on August 4, 2025, with a price of 0.89049.
| Level | Price |
|---|---|
| 0.236 | 0.90157 |
| 0.382 | 0.90611 |
| 0.5 | 0.91046 |
| 0.618 | 0.91480 |
| 0.786 | 0.92097 |
The current price is 0.93043, which is above all calculated Fibonacci retracement levels, suggesting that the retracement is not in progress and the trend is maintaining its upside momentum. These levels should be monitored closely, as a move towards any retracement level may indicate potential support zones.
The analysis suggests the 0.5 level at 0.91046 as a significant support region that could be tested should there be a pullback.
Conclusion
The AUDCAD's upward movement highlights potential sustained bullish momentum, although vigilance is advised given potential retracement towards identified Fibonacci levels. With economic factors like Australia's trade balance and Canada's energy prices serving as potential influencers, the monitoring of these retracement lines becomes crucial for analysts. As the price currently exceeds the 0.786 Fibonacci level, attention should be paid to any potential reversal signals that might arise, necessitating adaptive strategies for traders.