December 12, 2025 a 05:08 am

AUDCAD: Fibonacci Analysis
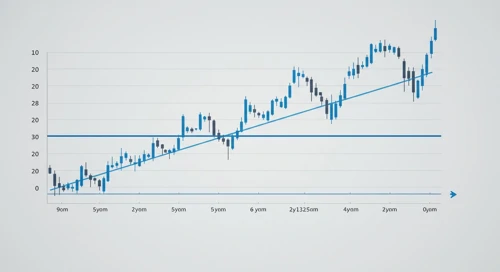
The AUDCAD currency pair shows a recently established dominant upward trend, following a period of stability. Given the ongoing dynamics between the Australian and Canadian economies, this trend aligns with recent commodity price movements benefiting the Australian dollar. With ongoing market fluctuations, investors should remain cautious.
Fibonacci Analysis
The identified upward trend for AUDCAD started in late August 2025 and extended through December. The trend shows significant bullish movement, peaking in December. Key Fibonacci retracement levels have been calculated from this movement to determine potential support and resistance areas.
| Analysis Details | Value |
|---|---|
| Start Date | 2025-08-21 |
| End Date | 2025-12-12 |
| High Price | 0.92251 (on 2025-10-06) |
| Low Price | 0.89242 (on 2025-08-21) |
| Current Price | 0.91819 |
| Fibonacci Level | Price Level |
|---|---|
| 0.236 | 0.89983 |
| 0.382 | 0.90694 |
| 0.5 | 0.91247 |
| 0.618 | 0.91799 |
| 0.786 | 0.92463 |
The current price of 0.91819 is in the 0.618 Fibonacci retracement zone, indicating potential support. This suggests a robust bullish momentum and potential continuation unless significant market interventions occur.
Conclusion
The AUDCAD shows promising upward potential with identified support near the 0.618 Fibonacci level. While the trend could encourage bullish activity, potential volatility derived from global economic events and commodity market changes should be considered. Analysts are therefore advised to account for these external variables when evaluating the sustainability of the trend. Caution is warranted with an eye on potential market fluctuations that could impact short-term profitability.