December 03, 2025 a 05:08 am
AUDCAD: Fibonacci Analysis
The AUDCAD currency pair has demonstrated recent volatility with notable movements. Traders should focus on the potential retracement levels given the recent trend dynamics. Analyzing historical trends can provide insights into potential future movements, allowing for better strategic trading decisions.
Fibonacci Analysis
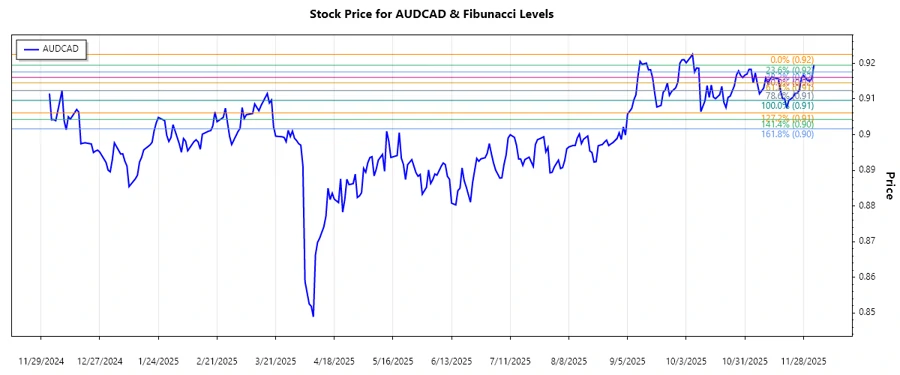
Based on the data provided, the most recent significant trend for AUDCAD is a downtrend, extending from a high point on 2025-10-06 to a low on 2025-12-03.
| Trend Period | High (Price & Date) | Low (Price & Date) |
|---|---|---|
| 2025-10-06 to 2025-12-03 | 0.92251 on 2025-10-06 | 0.9096 on 2025-11-21 |
| Fibonacci Level | Price Level |
|---|---|
| 0.236 | 0.91265 |
| 0.382 | 0.91499 |
| 0.5 | 0.91692 |
| 0.618 | 0.91885 |
| 0.786 | 0.92097 |
The current price of 0.9196 appears to be near the 0.618 retracement level, suggesting this zone could serve as resistance. This area may provide technical traders with signals related to market positioning and risk management.
Conclusion
The AUDCAD pair's retracement near the Fibonacci 0.618 level indicates potential resistance, thereby offering traders an opportunity to analyze potential reversal or continuation patterns. While the retracement levels offer potential areas for strategic positioning, traders must remain aware of broader market conditions. Currently, the pair shows resilience; however, the risk of further downward pressure remains. Analysts should consider monitoring other technical indicators as confirmation before making trading decisions.