October 13, 2025 a 05:08 am
AUDCAD: Fibonacci Analysis
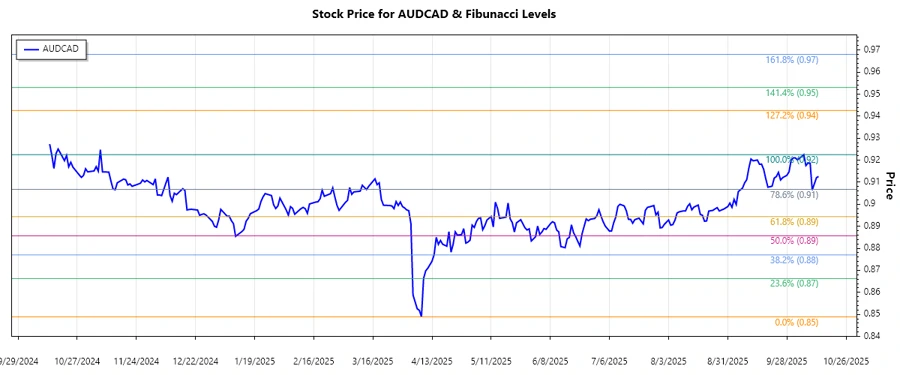
The AUDCAD currency pair has recently shown significant movement, predominantly characterized by an upward trend. This indicates strengthening in the Australian dollar relative to the Canadian dollar over the observed period. Investors should closely monitor these shifts, as they could signal potential opportunities or risks in trading strategies involving these currencies.
Fibonacci Analysis
| Trend | Start Date | End Date | High Price (Date) | Low Price (Date) |
|---|---|---|---|---|
| Uptrend | 2025-04-08 | 2025-10-08 | 0.92251 (2025-10-06) | 0.84887 (2025-04-08) |
| Fibonacci Level | Price Level |
|---|---|
| 0.236 | 0.86871 |
| 0.382 | 0.88074 |
| 0.5 | 0.88569 |
| 0.618 | 0.89863 |
| 0.786 | 0.91232 |
The current price is in the 0.786 Fibonacci retracement range. This indicates a potential strong support level if the price retraces to this area again. As Fibonacci levels often correspond to key psychological thresholds for traders, this could be indicative of further bullish support or a possible reversal at this level.
Conclusion
The AUDCAD has demonstrated a robust uptrend, reflected in the calculated Fibonacci levels. While the pair currently rests in a high retracement zone, this may indicate strong support which could bolster further gains. However, traders should be wary of potential reversals at these levels. A comprehensive analysis reveals that market sentiment and economic indicators should be monitored closely to validate this technical projection. Opportunely, traders adopting a bullish strategy could find these areas as potential entry points. Yet, they must remain cautious of adverse economic developments impacting these currencies. For technical analysts, these levels provide valuable insights into possible trade decisions.
Smart Data Insight
Master the Perfect Entry & Exit for this Stock
Don't leave your profits to chance. Historically, this stock follows specific seasonal patterns that institutional traders use to maximize returns.
- ✅ Identify the "Golden Buying Window"
- ✅ Avoid high-risk correction cycles
- ✅ Backtested data from the last 20+ years