August 22, 2025 a 05:08 am
AUDCAD: Fibunacci Analysis
The AUDCAD currency pair has shown a slight decrease over recent months. This technical analysis aims to assist traders in identifying key retracement levels that may hint at potential reversal points or areas of consolidation. With global economic conditions impacting trade relations, monitoring Fibonacci levels can be crucial to successfully navigating this pairing.
Fibonacci Analysis
| Aspect | Details |
|---|---|
| Start Date | 2025-03-19 |
| End Date | 2025-08-22 |
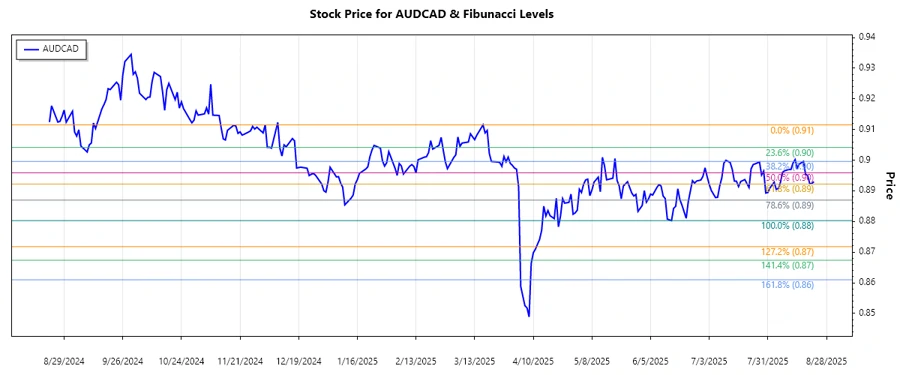
| High Price | 0.91152 (2025-03-17) |
| Low Price | 0.88028 (2025-06-15) |
Fibonacci Levels
| Level | Price |
|---|---|
| 0.236 | 0.88874 |
| 0.382 | 0.89607 |
| 0.5 | 0.90090 |
| 0.618 | 0.90573 |
| 0.786 | 0.91213 |
The current price of 0.89297 as of the last data point indicates it is within the 0.236 Fibonacci retracement zone, suggesting the downward trend may face resistance at this level.
This level aligns technically with a potential resistance, which if broken, may imply a directional change or a deeper retracement process in this currency pair.
Conclusion
The AUDCAD has primarily shown a downtrend, characterized by the lower high at 0.88028. The delineated Fibonacci levels suggest critical areas that might act as support or resistance. Presently, the currency pair is at a crucial juncture where it meets the 0.236 retracement, signifying potential resistance and a battleground for bulls and bears. Traders should remain vigilant, as breaking beyond this could see momentum carry the pair higher towards the 0.5 retracement level. Conversely, failure to breach could result in a continuation of downwards pressure. Given the global economic backdrop, these levels offer clear markers for trade setups in the currency market landscape.
Smart Data Insight
Master the Perfect Entry & Exit for this Stock
Don't leave your profits to chance. Historically, this stock follows specific seasonal patterns that institutional traders use to maximize returns.
- ✅ Identify the "Golden Buying Window"
- ✅ Avoid high-risk correction cycles
- ✅ Backtested data from the last 20+ years