
July 22, 2026 a 08:15 am
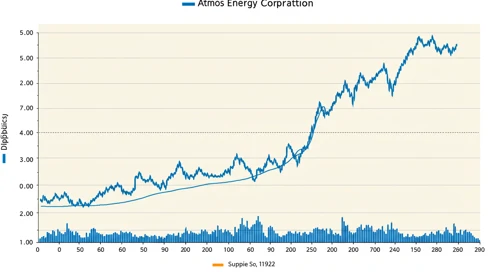


ATO: Trend and Support & Resistance Analysis - Atmos Energy Corporation
Atmos Energy Corporation – with its substantial operational reach in the U.S. natural gas distribution and pipeline storage sectors – presents intriguing investment opportunities. The analysis examines recent stock trends and key support and resistance zones, providing pivotal insights for investors.
Trend Analysis
The analysis of ATO's price movements reveals recent fluctuations with a partial recovery towards the end of the observed period. Calculating the EMA20 and EMA50 suggests notable trends. The current readings highlight:
| Date | Closing Price | Trend |
|---|---|---|
| 2026-07-21 | $175.05 | ▼ |
| 2026-07-20 | $177.33 | ▼ |
| 2026-07-17 | $177.68 | ▼ |
| 2026-07-16 | $178.04 | ▼ |
| 2026-07-15 | $174.98 | ▼ |
| 2026-07-14 | $178.45 | ▲ |
| 2026-07-13 | $179.50 | ▲ |
The calculated EMAs suggest a dominant downward trend towards the analysed period's end. This could signal potential bearish sentiments in the market.
Support and Resistance
The calculated support and resistance levels present critical insights into ATO's pricing dynamics.
| Zone Type | Price Range | Status |
|---|---|---|
| Support | $169.50 - $172.50 | ⚫ |
| Support | $166.00 - $168.50 | ⚫ |
| Resistance | $178.50 - $180.50 | ⚫ |
| Resistance | $182.00 - $184.00 | ⚫ |
The current price of ATO is approaching the lower resistance zone, indicating possible consolidation or a bearish reversal.
Conclusion
Atmos Energy Corporation's stock demonstrates significant volatility, highlighting the need for vigilance, especially as it nears support and resistance zones. Viewing the overall trajectory, potential future growth will largely depend on market reactions and fundamental undercurrents. Investors should weigh risks and prospects when considering commitments in this context.
JSON output:
Smart Data Insight
Master the Perfect Entry & Exit for this Stock
Don't leave your profits to chance. Historically, this stock follows specific seasonal patterns that institutional traders use to maximize returns.
- ✅ Identify the "Golden Buying Window"
- ✅ Avoid high-risk correction cycles
- ✅ Backtested data from the last 20+ years