April 08, 2026 a 01:15 pm
ATO: Trend and Support & Resistance Analysis - Atmos Energy Corporation
Atmos Energy Corporation, a key player in the regulated natural gas distribution and pipeline industry, has shown volatile yet promising performance in recent months. Investors should consider both technical signals and broader market conditions when evaluating stock potential. The current trend dynamics are influenced by global energy demands and regulatory changes in the U.S. energy sector.
Trend Analysis
| Date | Close Price | Trend |
|---|---|---|
| 2026-04-07 | 188.7 | ▲ Up |
| 2026-04-06 | 187.81 | ▲ Up |
| 2026-04-02 | 188.97 | ▲ Up |
| 2026-04-01 | 185.49 | ▼ Down |
| 2026-03-31 | 184.72 | ▼ Down |
| 2026-03-30 | 185.02 | ▲ Up |
| 2026-03-27 | 183.19 | ▼ Down |
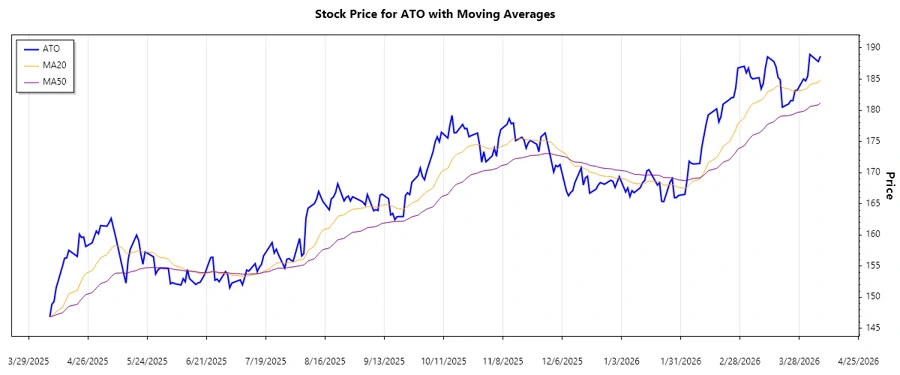
The current trend, based on EMA indicators, suggests a short-term uptrend. This is reinforced by higher highs and higher lows, with the EMA20 crossing above the EMA50. This directional change indicates potential bullish movement, supported by increased investor confidence.
Support and Resistance
| Zone Type | From | To |
|---|---|---|
| Support Zone 1 | 182.00 | 184.00 |
| Support Zone 2 | 178.00 | 180.00 |
| Resistance Zone 1 | 190.00 | 192.00 |
| Resistance Zone 2 | 194.00 | 196.00 |
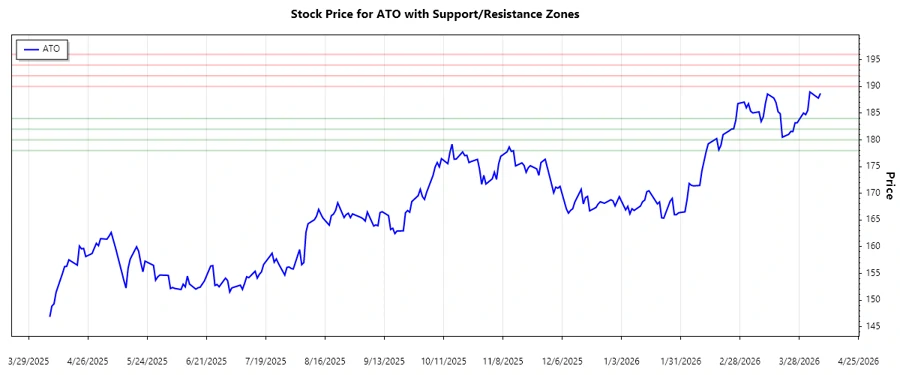
The current price is approaching the Resistance Zone 1, indicating potential selling pressure. Investors should watch for any break above this level to confirm bullish momentum or a reversal signal at the Resistance Zone.
Conclusion
The Atmos Energy stock currently displays an encouraging uptrend, with potential upward momentum reinforced by key support levels. However, approaching resistance levels suggest caution, particularly as market volatility remains a factor. Traders should be prepared for both potential breakout scenarios and reversals in line with broader energy market shifts and regulatory evolutions. Continuous monitoring of energy market trends and industry regulations will be crucial in guiding investment decisions in Atmos Energy Corporation.