May 15, 2026 a 05:15 am
ATO: Fibonacci Analysis - Atmos Energy Corporation
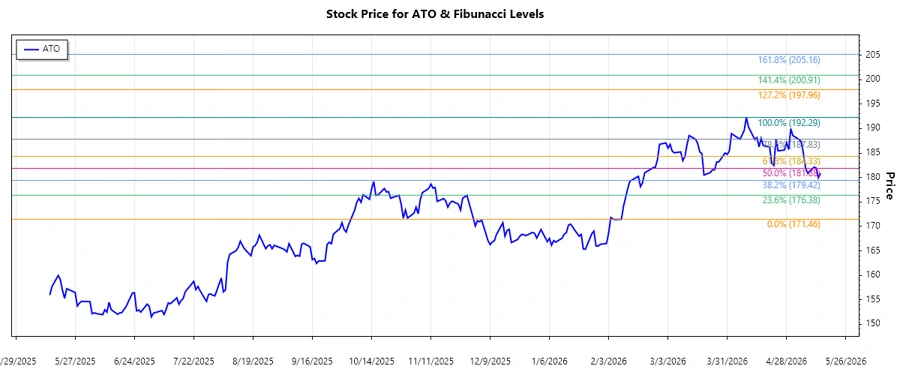
Atmos Energy Corporation, known for its significant role in the regulated natural gas distribution sector, is experiencing a compelling trend in its stock prices. The stock's recent performance highlights an upward trend, making it an attractive option for those considering investments in utilities. Investors are encouraged to analyze further and consider potential retracement levels to optimize entry points.
Fibonacci Analysis
| Start Date | End Date | High Price & Date | Low Price & Date |
|---|---|---|---|
| 2026-02-11 | 2026-04-09 | $192.29 (2026-04-09) | $171.46 (2026-02-09) |
| Fibonacci Level | Price |
|---|---|
| 0.236 | $176.79 |
| 0.382 | $179.93 |
| 0.5 | $181.87 |
| 0.618 | $183.81 |
| 0.786 | $187.01 |
Current price is not in a retracement zone. Technically, this suggests a strong trend continuation, highlighting potential future support in these retracement zones.
Conclusion
Atmos Energy Corporation showcases a robust upward trend, offering promising opportunities for growth. However, potential profit-taking could lead to short-term volatility. Without retracement, the stock appears poised for further gains. Analysts might view this as a buying opportunity, especially if retracement levels confirm future support, though caution is advised due to potential macroeconomic impacts affecting energy utilities.
Smart Data Insight
Master the Perfect Entry & Exit for this Stock
Don't leave your profits to chance. Historically, this stock follows specific seasonal patterns that institutional traders use to maximize returns.
- ✅ Identify the "Golden Buying Window"
- ✅ Avoid high-risk correction cycles
- ✅ Backtested data from the last 20+ years