November 24, 2025 a 11:31 am


ATO: Dividend Analysis - Atmos Energy Corporation
Atmos Energy Corporation (ATO) presents a solid opportunity for dividend-focused investors due to its steady dividend growth and long dividend history. The company has maintained a dividend payout despite economic cycles, indicating strong management and a stable business model. With reasonable dividend yields and efficient payout ratios, Atmos Energy shows potential as a reliable addition to a dividend portfolio.
Overview 📊
Atmos Energy is a key player in the utilities sector with a strong track record in dividend payouts. The company's consistent dividend history and growth make it attractive to income-focused investors.
| Metric | Detail |
|---|---|
| Sector | Utilities |
| Dividend yield | 2.06% |
| Current dividend per share | 3.48 USD |
| Dividend history | 41 years |
| Last cut or suspension | 1986 |
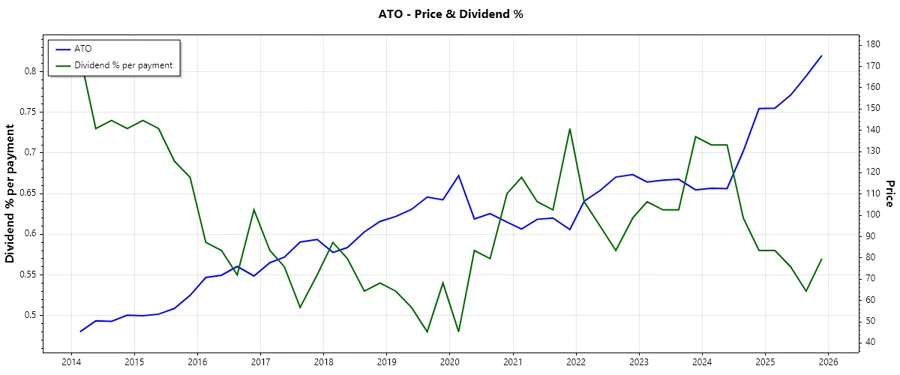
Dividend History 📈
The long history of dividend payments over 41 years assures investors of Atmos Energy's commitment to returning capital to shareholders. This history underlines a strong operational backbone capable of sustaining dividend payouts even during challenging periods.
| Year | Dividend Per Share (USD) |
|---|---|
| 2025 | 3.61 |
| 2024 | 3.285 |
| 2023 | 3.025 |
| 2022 | 2.78 |
| 2021 | 2.555 |
Dividend Growth 📈
Growth in dividends over the years is a critical indicator of a company's ability to increase shareholder value. Atmos Energy's steady increase in dividends reflects positive business performance and financial health, maintaining investor confidence.
| Time | Growth |
|---|---|
| 3 years | 8.74% |
| 5 years | 8.85% |
The average dividend growth is 8.85% over 5 years. This shows moderate but steady dividend growth.
Payout Ratio ✅
The payout ratio is a vital metric examining how comfortably a company can continue paying dividends from its earnings. A balanced ratio indicates a stable dividend policy and careful financial management.
| Key figure | Ratio |
|---|---|
| EPS-based | 47.88% |
| Free cash flow-based | -40.94% |
The EPS-based payout ratio of 47.88% suggests that Atmos Energy maintains a sustainable dividend policy. However, a negative free cash flow-based ratio indicates reliance on earnings to cover dividend payments.
Cashflow & Capital Efficiency 🏦
Cash flow and capital efficiency are key to understanding a company's ability to fund its operations and growth initiatives internally. Evaluation of these metrics aids in assessing operational efficiency.
| Year | 2023 | 2024 | 2025 |
|---|---|---|---|
| Free Cash Flow Yield | 4.25% | -5.69% | -5.57% |
| Earnings Yield | 5.76% | 4.93% | 4.42% |
| CAPEX to Operating Cash Flow | 81.10% | 169.41% | 173.77% |
| Stock-based Compensation to Revenue | 0.24% | 0.26% | 0.27% |
| Free Cash Flow / Operating Cash Flow Ratio | 18.90% | -69.41% | -73.77% |
Assessing these metrics, Atmos Energy's cash flow statements reveal that the company must optimize capital deployments to improve free cash flow stability.
Balance Sheet & Leverage Analysis 🏗️
A comprehensive analysis of the balance sheet provides insights into a company's financial stability and its ability to service its debt obligations while maintaining liquidity.
| Year | 2023 | 2024 | 2025 |
|---|---|---|---|
| Debt-to-Equity | 65.53% | 66.86% | 53.41% |
| Debt-to-Assets | 31.63% | 32.27% | 29.84% |
| Debt-to-Capital | 39.59% | 40.07% | 34.81% |
| Net Debt to EBITDA | 4.08 | 3.73 | 3.65 |
| Current Ratio | 0.65 | 0.94 | 0.77 |
| Quick Ratio | 0.45 | 0.78 | 0.77 |
| Financial Leverage | 2.07 | 2.07 | 1.79 |
Despite a high debt-to-capital ratio, Atmos Energy's ability to service its debt remains robust, with significant interest coverage highlighted across the periods analyzed.
Fundamental Strength & Profitability 💪
The evaluation of fundamental strengths, including overall profitability and efficiency ratios, provides a holistic understanding of value creation within the company.
| Year | 2023 | 2024 | 2025 |
|---|---|---|---|
| Return on Equity | 8.14% | 8.58% | 7.18% |
| Return on Assets | 3.93% | 4.14% | 4.01% |
| Margins: Net | 20.71% | 25.04% | 25.49% |
| EBITDA | 40.73% | 50.33% | 50.70% |
| Research & Development to Revenue | 0% | 0% | 0% |
Atmos Energy's profitability metrics show a strong and steadily growing company with good operational efficiency, despite no allocations to R&D.
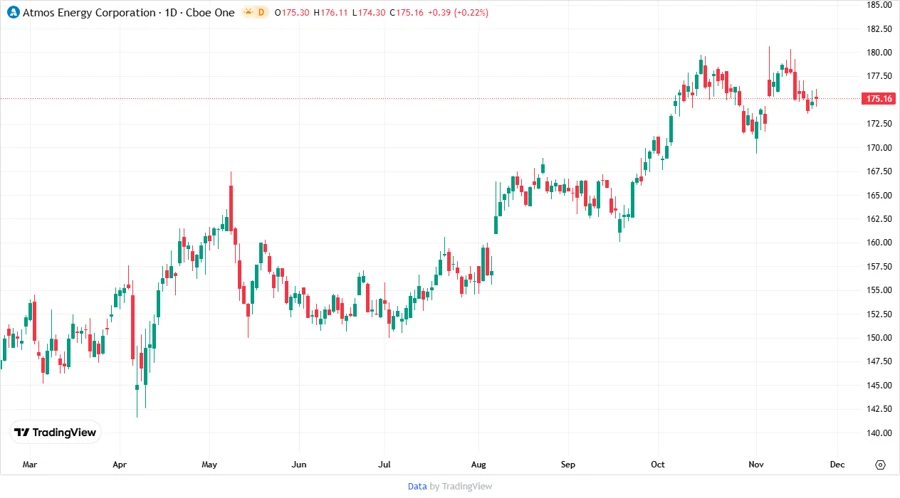
Price Development 📉
Dividend Scoring System 🏆
| Category | Score | Visualization |
|---|---|---|
| Dividend yield | 3 | |
| Dividend Stability | 5 | |
| Dividend growth | 4 | |
| Payout ratio | 3 | |
| Financial stability | 4 | |
| Dividend continuity | 5 | |
| Cashflow Coverage | 3 | |
| Balance Sheet Quality | 4 |
Overall score: 31/40
Rating 📊
In conclusion, Atmos Energy Corporation exhibits strong fundamental and financial metrics supportive of its solid dividend sustainability. With consistent growth and stable yields, this stock is highly recommendable for income-focused investors seeking reliability coupled with moderate growth potential.
Smart Data Insight
Master the Perfect Entry & Exit for this Stock
Don't leave your profits to chance. Historically, this stock follows specific seasonal patterns that institutional traders use to maximize returns.
- ✅ Identify the "Golden Buying Window"
- ✅ Avoid high-risk correction cycles
- ✅ Backtested data from the last 20+ years