May 25, 2025 a 07:46 am
ATO: Dividend Analysis - Atmos Energy Corporation
Atmos Energy Corporation is a major player in the utilities sector with a strong dividend profile. The company has demonstrated robust and reliable dividend payments over the years, albeit with some vulnerabilities reflected in negative cash flow aspects. Investors looking for consistent dividend income could find the stock appealing, while keeping an eye on its cash flow management and financial leverage.
📊 Overview
Atmos Energy Corporation is a well-established firm within the utilities sector, known for its steady income stream for investors through dividends. With a current dividend yield of 2.17%, it presents an attractive option for income-seeking investors. Sustained by a dividend history of 41 years without cuts or suspension, it provides a sense of dividend stability.
| Key Metrics | Details |
|---|---|
| Sector | Utilities |
| Dividend Yield | 2.17% |
| Current Dividend per Share | 3.23 USD |
| Dividend History | 41 years |
| Last Cut or Suspension | None |
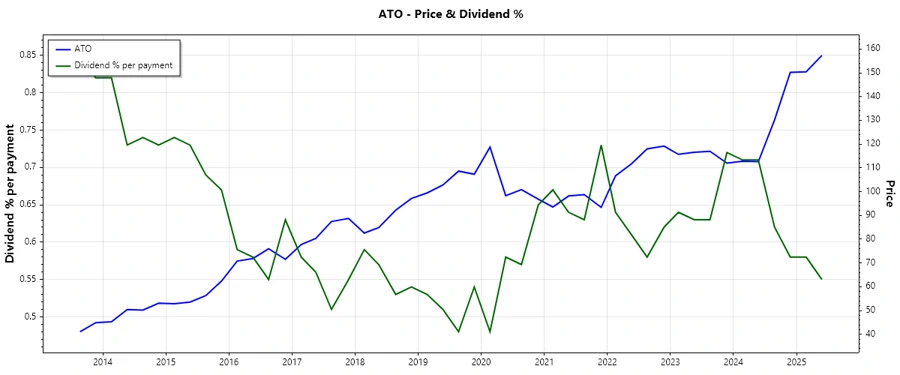
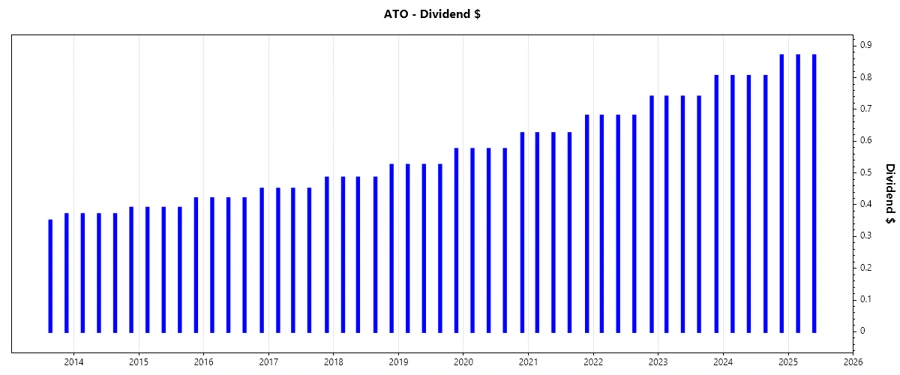
📉 Dividend History
Atmos Energy's historical dividend payments underscore its commitment to returning cash to shareholders. Understanding dividend history is vital as it reflects the company’s resilience during economic fluctuations. The constant increase in dividends can provide investors with an assurance of the firm's growth potential.
| Year | Dividend per Share (USD) |
|---|---|
| 2025 | 1.74 |
| 2024 | 3.285 |
| 2023 | 3.025 |
| 2022 | 2.78 |
| 2021 | 2.555 |
📈 Dividend Growth
In analyzing Atmos Energy's dividend growth, it's evident that the company maintains a moderate but steady increase. The growth metrics are essential to forecast potential future income, heavily influencing long-term investment decisions.
| Time | Growth |
|---|---|
| 3 years | 8.74% |
| 5 years | 8.85% |
The average dividend growth is 8.85% over 5 years. This shows moderate but steady dividend growth.
📈 Payout Ratio
Payout ratios provide insights into the sustainability of the dividend. Atmos Energy’s 45.25% EPS-based payout ratio indicates a solid dividend coverage from its earnings, while the negative free cash flow-based ratio suggests the need for cautious cash flow management.
| Key Figure | Ratio |
|---|---|
| EPS-based | 45.25% |
| Free cash flow-based | -39.32% |
The EPS-based payout ratio of 45.25% implies a well-covered dividend, whereas the negative free cash flow payout ratio suggests potential risks in cash availability for dividend payments.
💸 Cashflow & Capital Efficiency
Examining cash flow metrics and capital efficiency is critical for assessing the company's ability to sustain its dividend payments and potential for reinvesting in growth.
| Year | 2024 | 2023 | 2022 |
|---|---|---|---|
| Free Cash Flow Yield | -5.69% | 4.25% | -10.45% |
| Earnings Yield | 4.93% | 5.76% | 5.52% |
| CAPEX to Operating Cash Flow | 1.69 | 0.81 | 2.50 |
| Stock-based Compensation to Revenue | 0.26% | 0.24% | 0.26% |
| Free Cash Flow / Operating Cash Flow Ratio | -69.41% | 19% | -150% |
These figures highlight a challenge in free cash flow management, potentially affecting reinvestment capabilities and dividend payments sustainability.
⚠️ Balance Sheet & Leverage Analysis
Analyzing the balance sheet and leverage metrics helps investors understand the company's financial stability and its ability to meet obligations while funding growth.
| Year | 2024 | 2023 | 2022 |
|---|---|---|---|
| Debt-to-Equity | 0.67 | 0.65 | 0.87 |
| Debt-to-Assets | 0.32 | 0.31 | 0.37 |
| Debt-to-Capital | 0.40 | 0.39 | 0.46 |
| Net Debt to EBITDA | 3.73 | 4.03 | 5.43 |
| Current Ratio | 0.93 | 0.65 | 0.85 |
| Quick Ratio | 0.78 | 0.45 | 0.75 |
| Financial Leverage | 2.07 | 2.07 | 2.36 |
Although leverage is relatively high, manageable interest coverage indicates that the firm can meet its financial obligations.
🏦 Fundamental Strength & Profitability
Fundamentals and profitability ratios are crucial for evaluating the underlying strength and efficiency of a company in generating profits.
| Year | 2024 | 2023 | 2022 |
|---|---|---|---|
| Return on Equity | 8.58% | 8.14% | 8.22% |
| Return on Assets | 4.14% | 3.93% | 3.49% |
| Net Margin | 25.04% | 20.71% | 18.43% |
| EBIT Margin | 34.25% | 26.59% | 22.65% |
| EBITDA Margin | 50.33% | 40.79% | 35.47% |
| Gross Margin | 57.92% | 48.14% | 59.95% |
| R&D to Revenue | 0% | 0% | 0% |
The upward trend in profitability margins suggests a strong efficiency in operations, which is critical to maintaining competitive edges and sustaining dividend payments.
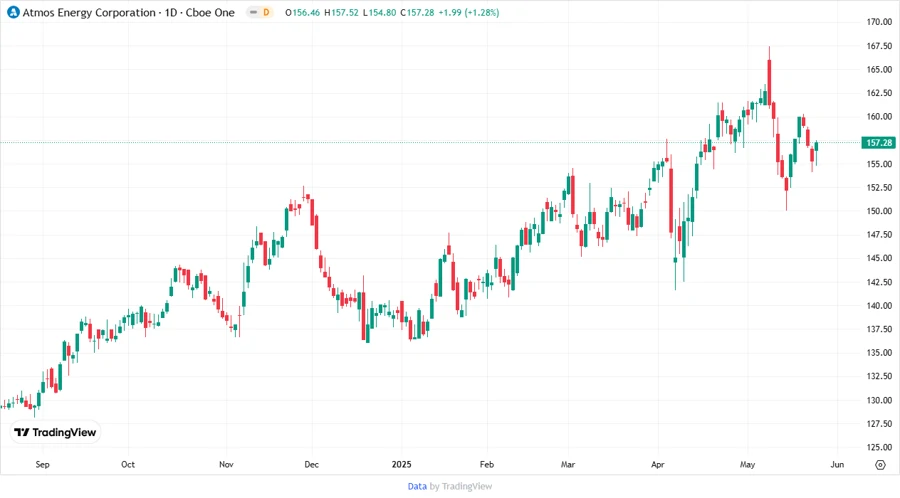
📈 Price Development
✅ Dividend Scoring System
| Criteria | Score | Indicator |
|---|---|---|
| Dividend Yield | 4 | |
| Dividend Stability | 5 | |
| Dividend Growth | 4 | |
| Payout Ratio | 3 | |
| Financial Stability | 3 | |
| Dividend Continuity | 5 | |
| Cashflow Coverage | 2 | |
| Balance Sheet Quality | 3 |
Total Score: 29/40
🗣️ Rating
Atmos Energy Corporation displays a commendable balance between dividend yield and company growth potential. While some concerns persist around cash flow sustainability and financial leverage, the overall stability and continuity in dividends make it an attractive prospect for income-focused investors.
Smart Data Insight
Master the Perfect Entry & Exit for this Stock
Don't leave your profits to chance. Historically, this stock follows specific seasonal patterns that institutional traders use to maximize returns.
- ✅ Identify the "Golden Buying Window"
- ✅ Avoid high-risk correction cycles
- ✅ Backtested data from the last 20+ years