RTX: Dividend Analysis - RTX Corporation

RTX: In-depth analysis of a company's dividend stability and key fundamental ratios to assess its financial strength and long-term investment potential.
June 06, 2026 a 07:31 am
ROK: Fibunacci Level Technical Analysis - Rockwell Automation Inc

ROK: Fibonacci retracement levels to identify key potential support and resistance zones, based on recent price trends.
June 06, 2026 a 06:44 am
TPR: Fibunacci Level Technical Analysis - Tapestry Inc
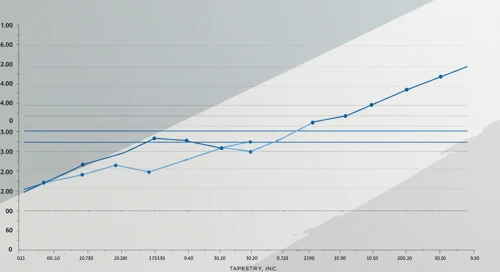
TPR: Fibonacci retracement levels to identify key potential support and resistance zones, based on recent price trends.
June 06, 2026 a 05:15 am
GBPUSD: Fibunacci Level Technical Analysis

GBPUSD: Fibonacci retracement levels to identify key potential support and resistance zones, based on recent price trends.
June 06, 2026 a 05:08 am
VTR: Trend with Support and Resistance Levels - Ventas Inc
VTR: Current price trend is evaluated alongside key support and resistance level. View of potential turning points and price momentum.
June 06, 2026 a 04:03 am
EA: Dividend Analysis - Electronic Arts Inc

EA: In-depth analysis of a company's dividend stability and key fundamental ratios to assess its financial strength and long-term investment potential.
June 06, 2026 a 03:30 am
CARR: Trend with Support and Resistance Levels - Carrier Global Corporation
CARR: Current price trend is evaluated alongside key support and resistance level. View of potential turning points and price momentum.
June 06, 2026 a 03:15 am
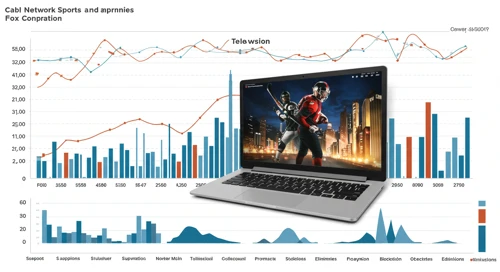
FOX: Analysts Ratings - Fox Corporation
June 06, 2026 a 08:38 am

CSX: Trend with Support and Resistance Levels - CSX Corporation
June 06, 2026 a 08:15 am

PM: Fundamental Ratio Analysis - Philip Morris International Inc
June 06, 2026 a 08:00 am

RL: Fundamental Ratio Analysis - Ralph Lauren Corporation
June 06, 2026 a 07:43 am
EBAY: Dividend Analysis - eBay Inc

EBAY: In-depth analysis of a company's dividend stability and key fundamental ratios to assess its financial strength and long-term investment potential.
June 06, 2026 a 02:46 am
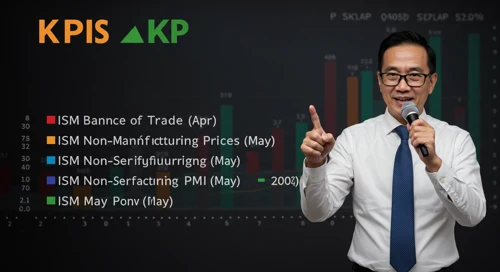
Todays Important Key Figures 06 Jun

Today’s important economic data releases – a snapshot of key indicators influencing markets and shaping financial expectations.
June 05, 2026 a 11:00 pm
DVA: Analysts Ratings - DaVita Inc

DVA: Comprehensive breakdown of current and historical analyst ratings, offering insights into how expert sentiment has evolved over time.
June 05, 2026 a 08:38 pm
GNRC: Fundamental Ratio Analysis - Generac Holdings Inc

GNRC: Evaluation of key financial ratios, analyst ratings, and price targets. A data-driven perspective on the valuation and market expectations.
June 05, 2026 a 07:43 pm
Todays Important Key Figures 05 Jun

Today’s important economic data releases – a snapshot of key indicators influencing markets and shaping financial expectations.
June 05, 2026 a 07:00 pm
ROK: Fundamental Ratio Analysis - Rockwell Automation Inc

ROK: Evaluation of key financial ratios, analyst ratings, and price targets. A data-driven perspective on the valuation and market expectations.
June 05, 2026 a 06:00 pm
SYY: Analysts Ratings - Sysco Corporation

SYY: Comprehensive breakdown of current and historical analyst ratings, offering insights into how expert sentiment has evolved over time.
June 05, 2026 a 05:00 pm
Stock Market - Heatmap
Use mouse wheel to zoom in and out. Click a ticker to display detailed information in a new window. Hover mouse cursor over a ticker to see more data.
Stock's
WEC: Fibunacci Level Technical Analysis - WEC Energy Group Inc

WEC: Fibonacci retracement levels to identify key potential support and resistance zones, based on recent price trends.
June 05, 2026 a 03:15 pm
GEV: Trend with Support and Resistance Levels - GE Vernova Inc

GEV: Current price trend is evaluated alongside key support and resistance level. View of potential turning points and price momentum.
June 05, 2026 a 02:03 pm
NSC: Analysts Ratings - Norfolk Southern Corporation

NSC: Comprehensive breakdown of current and historical analyst ratings, offering insights into how expert sentiment has evolved over time.
June 05, 2026 a 01:00 pm
MA: Fundamental Ratio Analysis - Mastercard Incorporated

MA: Evaluation of key financial ratios, analyst ratings, and price targets. A data-driven perspective on the valuation and market expectations.
June 05, 2026 a 01:00 pm
VMC: Dividend Analysis - Vulcan Materials Company

VMC: In-depth analysis of a company's dividend stability and key fundamental ratios to assess its financial strength and long-term investment potential.
June 05, 2026 a 12:46 pm
EMR: Analysts Ratings - Emerson Electric Co

EMR: Comprehensive breakdown of current and historical analyst ratings, offering insights into how expert sentiment has evolved over time.
June 05, 2026 a 12:38 pm
TRMB: Fibunacci Level Technical Analysis - Trimble Inc
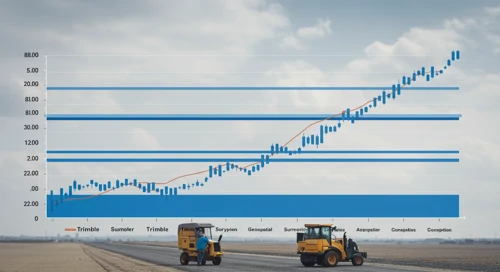
TRMB: Fibonacci retracement levels to identify key potential support and resistance zones, based on recent price trends.
June 05, 2026 a 11:44 am

EW: Fibunacci Level Technical Analysis - Edwards Lifesciences Corporation
June 05, 2026 a 04:44 pm

ROL: Analysts Ratings - Rollins Inc
June 05, 2026 a 04:38 pm

CVS: Fundamental Ratio Analysis - CVS Health Corporation
June 05, 2026 a 03:43 pm

FOXA: Dividend Analysis - Fox Corporation
June 05, 2026 a 03:30 pm
KEY: Fundamental Ratio Analysis - KeyCorp

KEY: Evaluation of key financial ratios, analyst ratings, and price targets. A data-driven perspective on the valuation and market expectations.
June 05, 2026 a 11:43 am
LYB: Dividend Analysis - LyondellBasell Industries NV
LYB: In-depth analysis of a company's dividend stability and key fundamental ratios to assess its financial strength and long-term investment potential.
June 05, 2026 a 11:31 am
ARE: Fibunacci Level Technical Analysis - Alexandria Real Estate Equities Inc

ARE: Fibonacci retracement levels to identify key potential support and resistance zones, based on recent price trends.
June 05, 2026 a 10:15 am
GD: Trend with Support and Resistance Levels - General Dynamics Corporation

GD: Current price trend is evaluated alongside key support and resistance level. View of potential turning points and price momentum.
June 05, 2026 a 09:03 am
PLTR: Analysts Ratings - Palantir Technologies Inc

PLTR: Comprehensive breakdown of current and historical analyst ratings, offering insights into how expert sentiment has evolved over time.
June 05, 2026 a 09:00 am
PANW: Analysts Ratings - Palo Alto Networks Inc
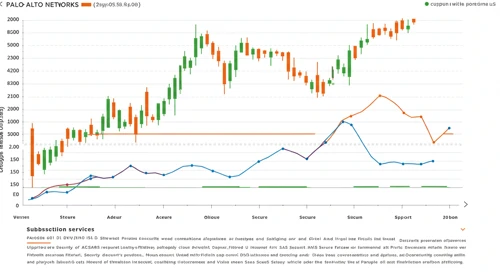
PANW: Comprehensive breakdown of current and historical analyst ratings, offering insights into how expert sentiment has evolved over time.
June 05, 2026 a 08:38 am
SPGI: Trend with Support and Resistance Levels - SandP Global Inc

SPGI: Current price trend is evaluated alongside key support and resistance level. View of potential turning points and price momentum.
June 05, 2026 a 08:15 am
Economic Calendar
Currencies
EURJPY: Trend with Support and Resistance Levels

EURJPY: Current price trend is evaluated alongside key support and resistance level. View of potential turning points and price momentum.
June 04, 2026 a 04:28 am
Important Key Figures of the last Days

Overview of key economic indicators released over the past days, highlighting their potential impact on markets and investor sentiment.
June 04, 2026 a 02:31 am
Todays Important Key Figures 03 Jun
Today’s important economic data releases – a snapshot of key indicators influencing markets and shaping financial expectations.
June 03, 2026 a 07:00 pm
USDCAD: Fibunacci Level Technical Analysis

USDCAD: Fibonacci retracement levels to identify key potential support and resistance zones, based on recent price trends.
June 03, 2026 a 05:08 am
Todays Important Key Figures 02 Jun

Today’s important economic data releases – a snapshot of key indicators influencing markets and shaping financial expectations.
June 02, 2026 a 07:00 pm
NZDJPY: Fibunacci Level Technical Analysis
NZDJPY: Fibonacci retracement levels to identify key potential support and resistance zones, based on recent price trends.
June 02, 2026 a 05:08 am
USDJPY: Trend with Support and Resistance Levels
USDJPY: Current price trend is evaluated alongside key support and resistance level. View of potential turning points and price momentum.
June 02, 2026 a 04:28 am

CADJPY: Fibunacci Level Technical Analysis
June 05, 2026 a 05:08 am

CADCHF: Trend with Support and Resistance Levels
June 05, 2026 a 04:28 am

Todays Important Key Figures 04 Jun
June 04, 2026 a 07:00 pm

GBPSEK: Fibunacci Level Technical Analysis
June 04, 2026 a 05:08 am
Important Key Figures of the last Days

Overview of key economic indicators released over the past days, highlighting their potential impact on markets and investor sentiment.
June 02, 2026 a 02:31 am
Todays Important Key Figures 01 Jun

Today’s important economic data releases – a snapshot of key indicators influencing markets and shaping financial expectations.
June 01, 2026 a 07:00 pm
NZDCAD: Fibunacci Level Technical Analysis
NZDCAD: Fibonacci retracement levels to identify key potential support and resistance zones, based on recent price trends.
June 01, 2026 a 05:08 am
AUDCAD: Trend with Support and Resistance Levels

AUDCAD: Current price trend is evaluated alongside key support and resistance level. View of potential turning points and price momentum.
June 01, 2026 a 04:28 am
AUDJPY: Fibunacci Level Technical Analysis

AUDJPY: Fibonacci retracement levels to identify key potential support and resistance zones, based on recent price trends.
May 31, 2026 a 05:08 am
AUDNZD: Trend with Support and Resistance Levels

AUDNZD: Current price trend is evaluated alongside key support and resistance level. View of potential turning points and price momentum.
May 31, 2026 a 04:28 am
EURUSD: Fibunacci Level Technical Analysis
EURUSD: Fibonacci retracement levels to identify key potential support and resistance zones, based on recent price trends.
May 30, 2026 a 05:08 am
Currencies