June 05, 2026 a 10:15 am

ARE: Fibonacci Analysis - Alexandria Real Estate Equities, Inc.
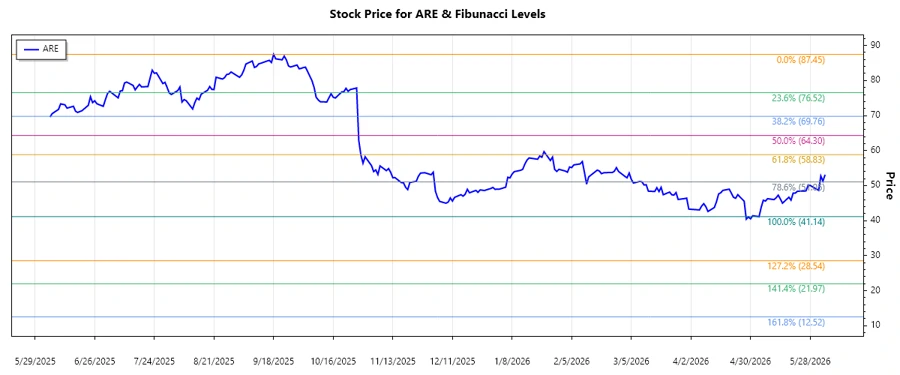
Alexandria Real Estate Equities, Inc. (ARE) has been experiencing a notable downtrend in recent months, primarily impacted by broader market dynamics. As a leading REIT focused on life sciences and technology campuses, its stock price has seen high volatility. This analysis aims to provide insights through Fibonacci retracements, which may help identify potential support and resistance levels for future price movements.
Fibonacci Analysis
| Description | Details |
|---|---|
| Analyzed Trend Period | 2025-06-05 to 2026-06-04 |
| Trend Type | Downward |
| High Price | $87.45 (2025-09-18) |
| Low Price | $41.14 (2026-05-04) |
| Fibonacci Levels |
|
| Current Price | $53.12 (2026-06-04) |
| Current Retracement Zone | 0.236 |
| Interpretation | The current price is in the 0.236 retracement zone, suggesting that it might face some resistance as it attempts to climb higher. |
| Technical Insight | The 0.236 retracement level could act as a short-term resistance. If the price surpasses this level, it may head towards the 0.382 level, indicating a potential shift in market sentiment. |
Conclusion
The recent downward trend in ARE's stock price highlights the volatility within the sector, influenced by macroeconomic conditions and sector-specific challenges. The Fibonacci retracement analysis indicates that, while the price is currently facing resistance at the 0.236 level, surpassing this could signal further recovery. Investors should be cautious of potential reversals at key levels and watch for maintaining support at the low price. For analysts, these Fibonacci levels are crucial for anticipating potential price directions and identifying opportunities amidst uncertainties.
Smart Data Insight
Master the Perfect Entry & Exit for this Stock
Don't leave your profits to chance. Historically, this stock follows specific seasonal patterns that institutional traders use to maximize returns.
- ✅ Identify the "Golden Buying Window"
- ✅ Avoid high-risk correction cycles
- ✅ Backtested data from the last 20+ years