April 26, 2026 a 04:44 pm

ARE: Fibonacci Analysis - Alexandria Real Estate Equities, Inc.
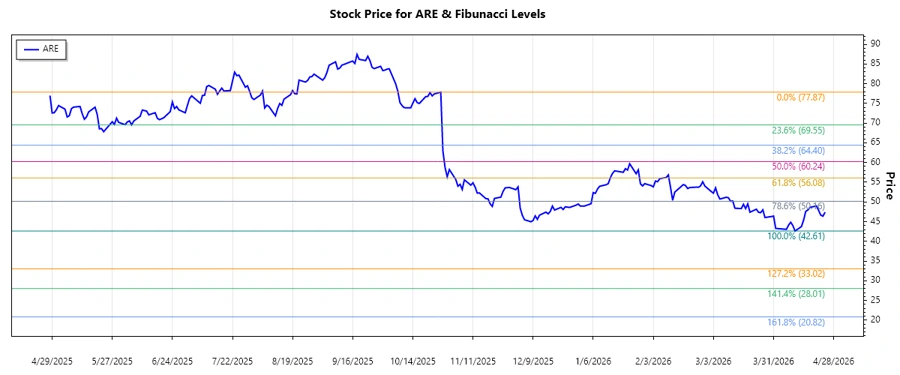
Alexandria Real Estate Equities (ARE) has shown significant price movements, particularly marked by a substantial downtrend from late 2025 into 2026. As a player in urban life science office real estate, ARE's financial performance can be highly sensitive to market conditions, which is reflected in its recent price decline. This analysis leverages technical tools such as Fibonacci retracements to assess potential pivot points in the market.
Fibonacci Analysis
| Trend Period | High Price (Date) | Low Price (Date) |
|---|---|---|
| 2025-10-27 to 2026-04-24 | $77.87 (2025-10-27) | $42.61 (2026-04-10) |
| Fibonacci Level | Price Level |
|---|---|
| 0.236 | $51.87 |
| 0.382 | $56.30 |
| 0.5 | $60.24 |
| 0.618 | $64.18 |
| 0.786 | $69.00 |
As of the current date, the last price recorded is $47.4. This places the stock below the 0.236 Fibonacci retracement level, indicating it is not currently within a common retracement zone. The technical analysis suggests that price levels could act as future resistance if the stock begins to recover.
Conclusion
Despite the recent downtrend, Alexandria Real Estate Equities (ARE) remains a key player in the life science office real estate sector. The technical indicators show significant potential for price recovery based on historical performance. However, current market conditions may continue to exert downward pressure. Analysts should closely monitor for signs of reversal patterns or increasing demand that might signal a more sustained recovery. The stock's past volatility demonstrates both risk and opportunity, suggesting that strategic positioning could reap rewards for informed investors.